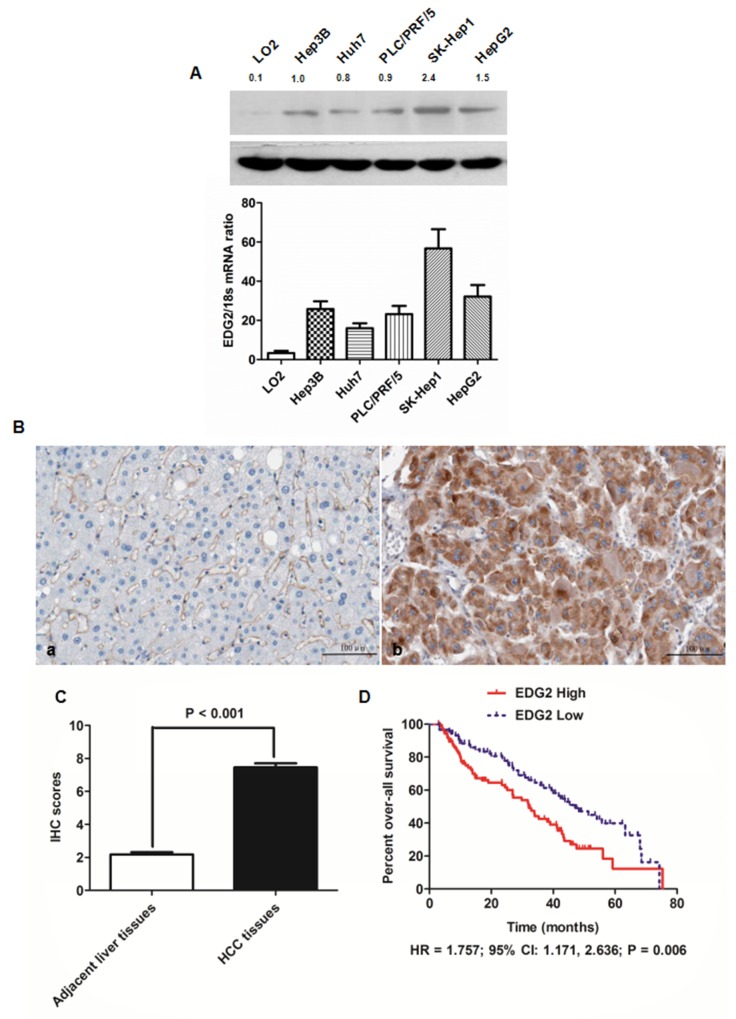
Figure 1. EDG2 was over-expressed in both HCC cell lines and HCC tissues.
(A) As assessed by both Western immunoblotting and qRT-PCR, there was significantly more EDG2 expression in all HCC cell lines (including Hep3B, Huh7, PLC/PRF/5, SK-Hep1 and HepG2) in contrast to normal liver cell LO2 at the level of protein and mRNA. (B) The left panel was the representative picture of EDG2 IHC staining in adjacent liver tissues, while the representative picture of EDG2 IHC staining was the right panel. It was notably that EDG2 expression was up-regulated aberrantly in HCC tissues compared to adjacent liver tissues. (C) Mann-Whitney U test displayed that there was remarkably more EDG2 expression in HCC tissues than adjacent liver tissues. (D) Comparison of Kaplan-Meier survival curves demonstrated that HCC patients from EDG2 high group suffered from the worse over-all survival after liver resection than those from EDG2 low group (HR = 1.757; 95% CI: 1.171, 2.636; P = 0.006).

