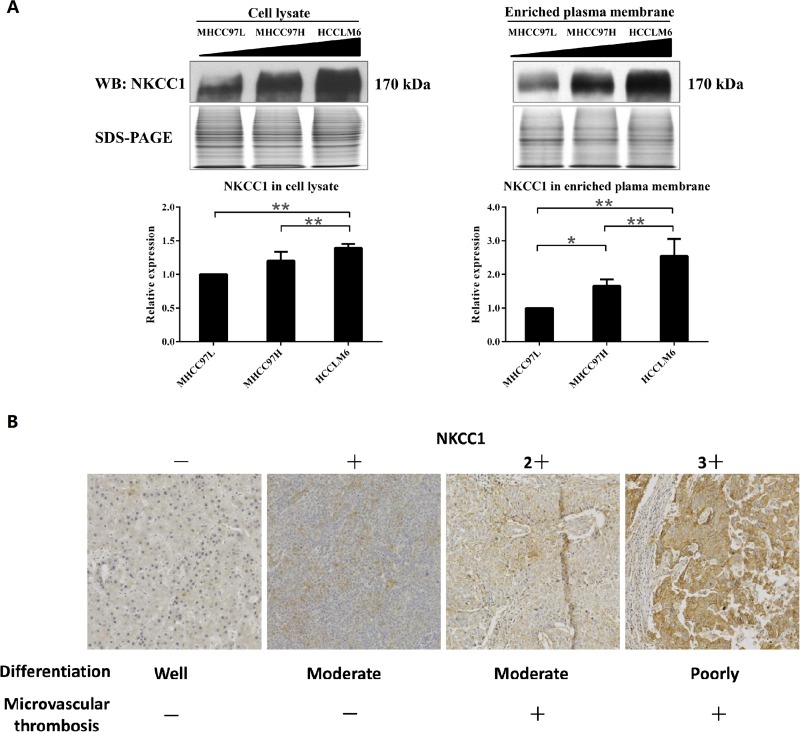
Figure 2. Detection of NKCC1 in MHCC97 cell lines and HCC tissues.
(A) Western blotting results validated the upregulation of NKCC1 in highly metastatic HCC cell lines. The triangle indicates the sequentially increased metastatic abilities of the MHCC97L, MHCC97H and HCCLM6 cell lines. * p<0.05 or ** p<0.01 indicates a significant difference of NKCC1 expression level between HCC cell lines (one-way ANOVA). (B) The representative immunohistochemistry staining results of NKCC1 in HCC tumor tissue. (F-a) Result of sample W2 as the representative staining of (-). Weak and partial plasma membrane staining in ≤10% cancer cells. (F-b) Result of sample C7 as the representative staining of (1+). Weak and partial plasma membrane staining in >10% cancer cells. (F-c) Result of sample C1 as the representative staining of (2+). Moderate and partial plasma membrane staining in >10% cancer cells, or strong and complete plasma membrane staining in ≤10% cancer cells. (F-d) Result of sample C9 as the representative staining of (3+). Strong and complete plasma membrane staining in >10% cancer cells.

