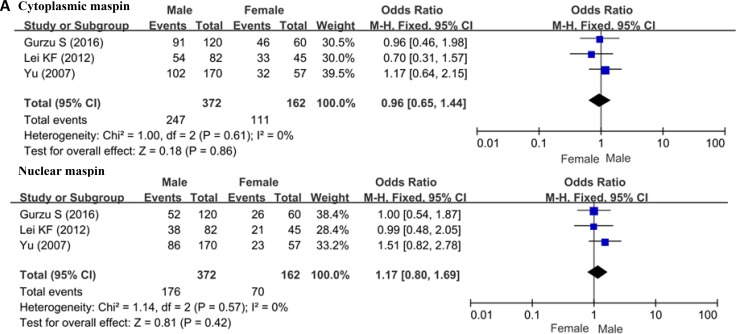
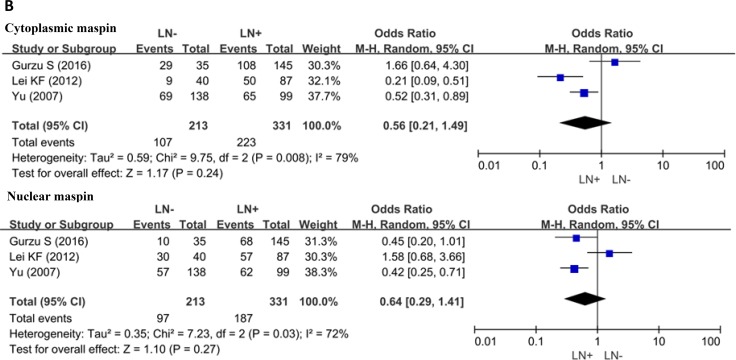
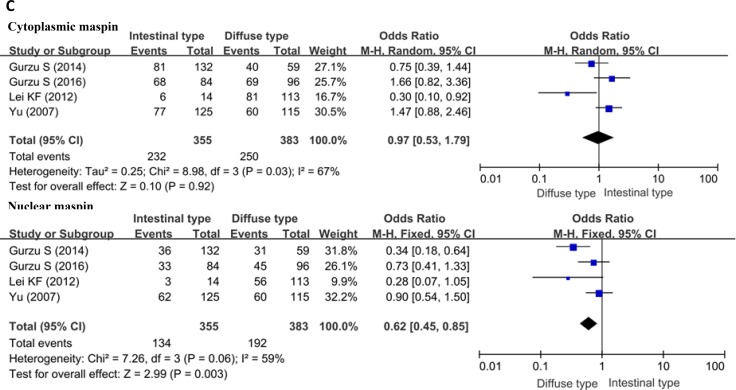
Figure 3. Forest plot for the relationship between cytoplasmic or nuclear maspin expression and clinicopathological parameters of gastric cancer.
(A) correlation between sex and maspin expression (male vs female); (B) correlation between lymph node metastasis (LN) and maspin expression (LN− vs LN+); (C) correlation between differentiation and maspin (intestinal-type vs diffuse-type).


