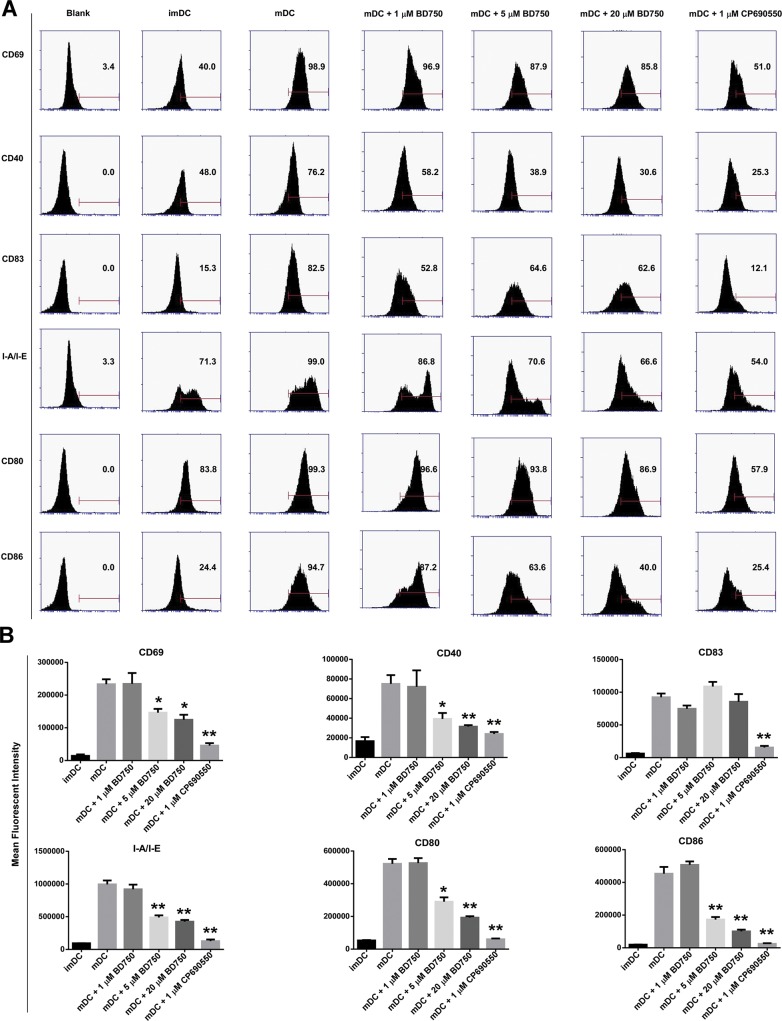
Figure 2.
Analysis of maturation status of BD750-treated DCs by flow cytometry. After different treatments, the different groups of DCs were stained with the indicated antibodies and the levels of surface molecule expression were determined by flow cytometry. Data are representative histograms or expressed as the mean ± SEM of three independent experiments. (A) Flow cytometry analysis. (B) Quantitative analysis. *P < 0.05, **P < 0.01 versus the mDC group.

