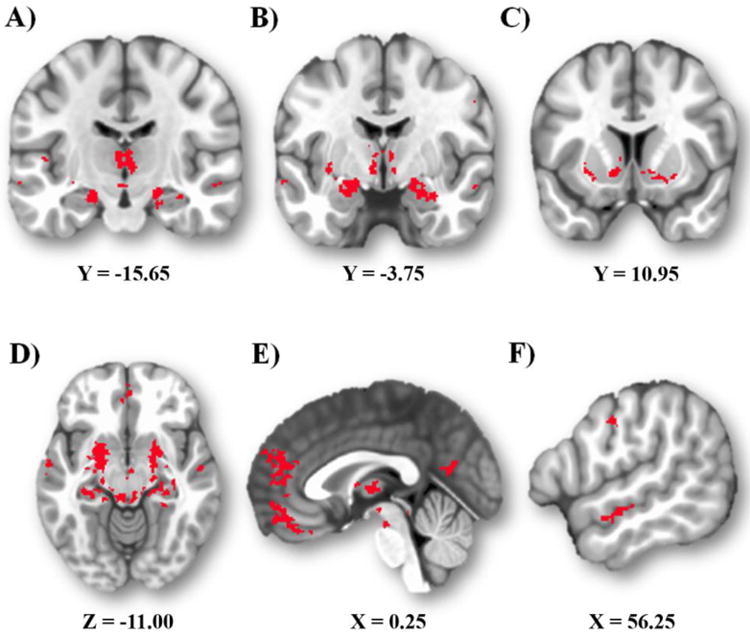
Figure 2.

Shared coupling. Regions showing significant iFC with both the CeA and BNST are depicted in red (p<.05, whole-brain corrected). A) Thalamus and hippocampus. B) Amygdala, including regions of the lateral and basal nuclei. C) Striatum, including the caudate, putamen, and ventral striatum. D) Midbrain, including the PAG. E) mPFC. F) Superior temporal sulcus.
