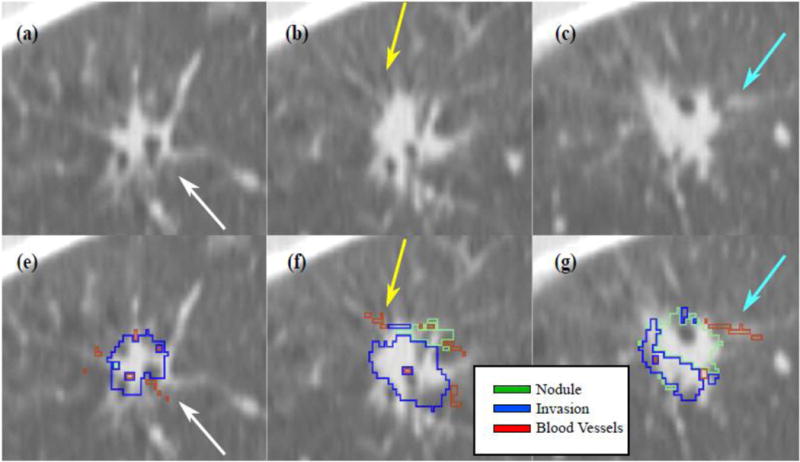
Figure 6.

Sagittal view of the histology – CT fusion results (same nodule as in Figures 3–5). The arrows point to a corresponding blood vessel mapped from histology onto CT; (a–c) Sagittal view of slices in the CT reconstruction; (e–f) corresponding mapping of invasive component (blue) and blood vessels (red) onto CT.
