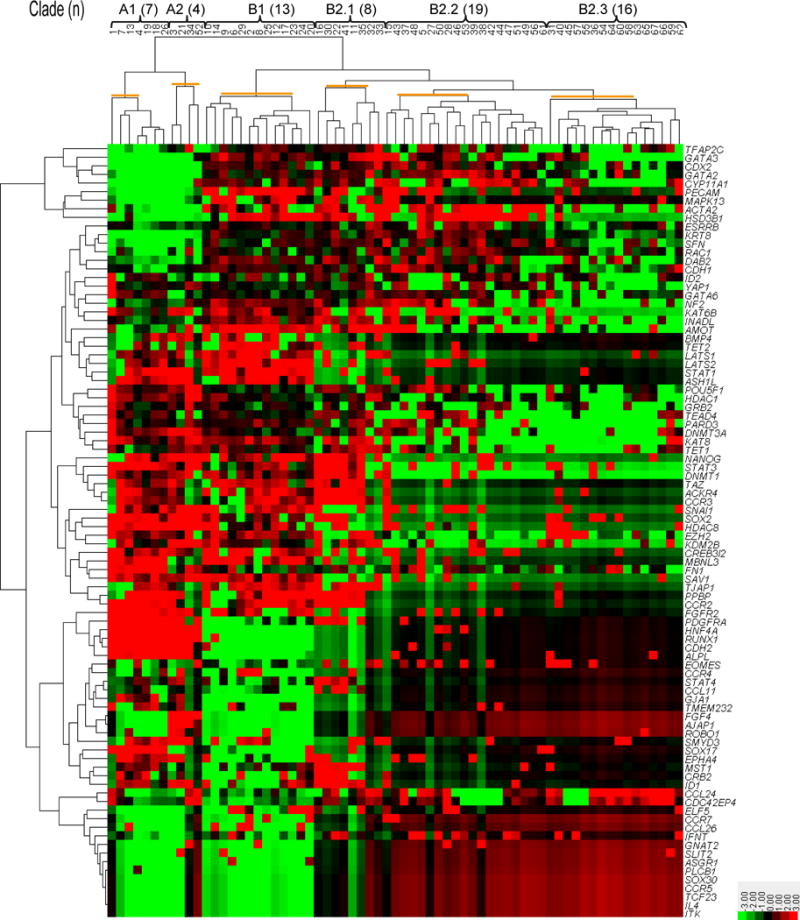
FIGURE 1.

Identification of embryonic cell populations by unsupervised clustering analysis of gene expression. Heatmaps were generated for expression levels of 90 genes from 67 individual blastomeres after normalizing to housekeeping genes, ACTB and GAPDH. The output yielded two major clades (A and B) that were subdivided into six smaller clusters (highlighted with orange lines): A1, A2, B1, B2.1, B2.2 and B2.3. The numbers in parentheses are the number of cells in each group. The color key is at the bottom right (−3=bright green, 0=black, 3=bright red).
