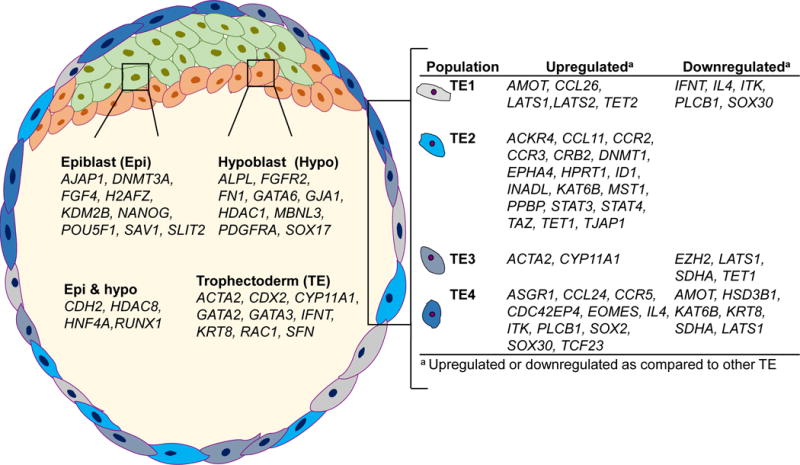
FIGURE 11.

Model of genes whose expression differs between cell populations in the bovine blastocyst. Genes listed under Epiblast, Hypoblast, Epi & hypo and Trophectoderm were upregulated in that cell type as compared to other cell populations: For the four populations of trophectoderm cells, two types of genes are listed: those that were upregulated relative to one or more other populations of trophectoderm cells and those that were downregulated.
