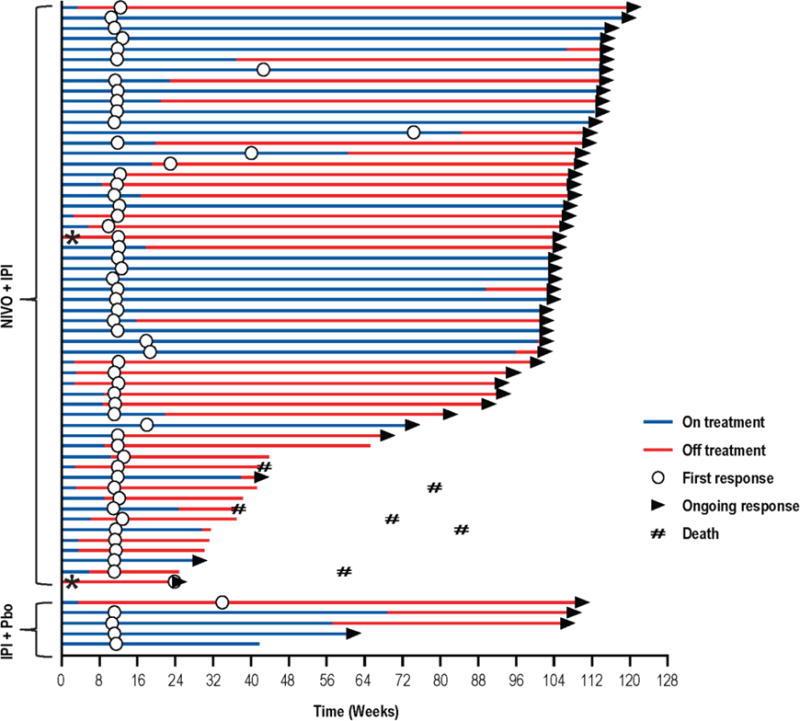
Figure 4. Time to and duration of response.

Swimmer plots show time to first response and duration of response, as defined by RECIST version 1.1, for responders who received nivolumab plus ipilimumab (top) or ipilimumab plus placebo (bottom). *Patients received only one dose of combination therapy before discontinuing treatment. Pbo=placebo.
