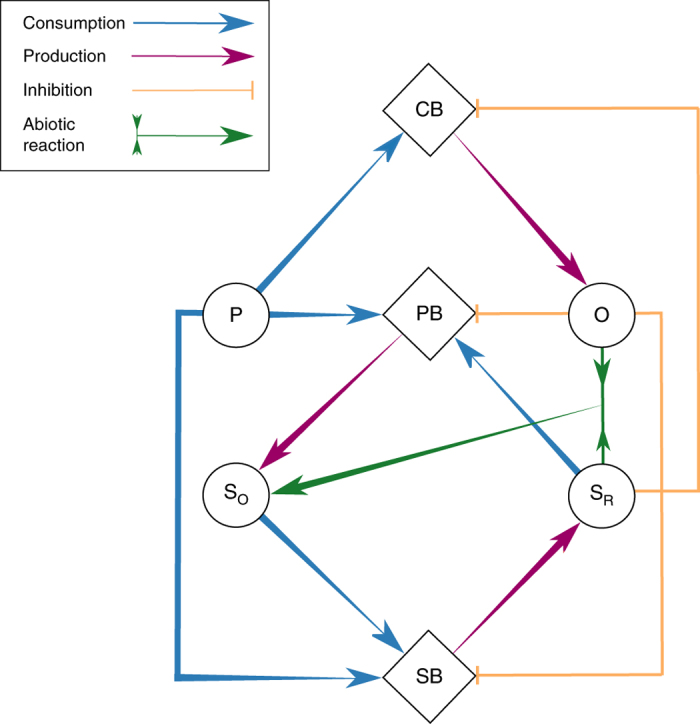
Fig. 1.

Schematic diagram of the microbial ecosystem model. The model consists of three bacterial functional groups (CB cyanobacteria, PB phototrophic sulfur bacteria, SB sulfate-reducing bacteria) and four chemical substrates (P phosphorus, O oxygen, SR reduced sulfur, SO oxidized sulfur). Arrows denote the consumption (blue arrows) and production (magenta arrows) of chemicals by the microbial populations. Orange lines represent growth inhibition of the microbial populations. Green arrows indicate abiotic oxidation of reduced sulfur to oxidized sulfur
