Fig. 6.
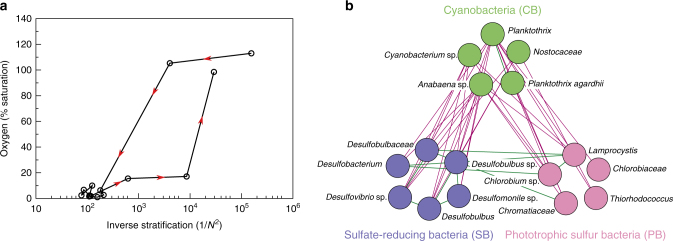
Evidence for regime shifts between oxic and anoxic states in Lake Vechten. a Hysteresis loop of oxygen saturation in the hypolimnion (7 m depth) plotted against the inverse of the stratification strength (1/N 2, where N 2 is the squared buoyancy frequency). The inverse of the stratification strength provides a simple proxy of oxygen diffusivity across the thermocline (see Methods). Data points are from March 2013 to March 2014; red arrows indicate the direction of time. b Co-occurrence network of bacteria in the metalimnion, based on 16S rRNA sequence data. Green lines represent positive interactions (co-occurrence), whereas magenta lines represent negative interactions (mutual exclusion)

