Fig. 10.
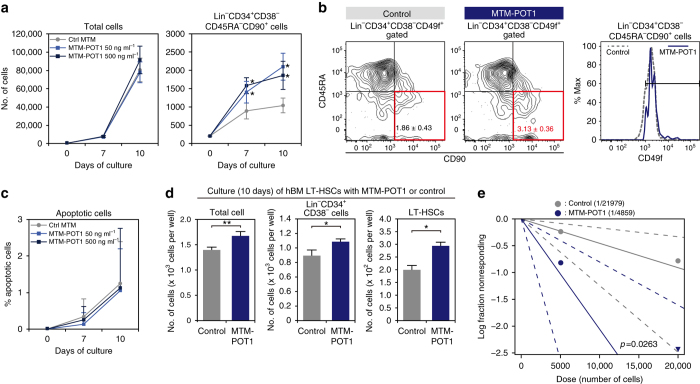
POT1 maintains self-renewal activity of human HSCs. hCB-derived LT-HSCs (200 cells per well) were cultured for 10 days with or without MTM-POT1. a Number of total cells (left) and Lin–CD34+CD38−CD45RA−CD90+ cells on day 7 and 10 of culture. Data are expressed as the mean ± SD (n = 10, *p < 0.01 by t-test). b Representative FACS profiles of CD90 and CD45RA in Lin–CD34+CD38–CD49f+ cells (left) and the expression of CD49f in the Lin–CD34+CD38−CD45RA−CD90+ fraction (right). c Percentage of Annexin V+PI+ apoptotic cells in Lin–CD34+CD38−CD45RA−CD90+ cells on day 7 and 10 of culture. Data are expressed as the mean ± SD (n = 11: day 7, n = 9: day 10). d LT-HSCs isolated from hBM (200 cells per well) were cultured for 10 days with or without MTM-POT1 (50 ng ml–1). Number of total cells, CD34+CD38− cells, and LT-HSCs after culture are shown. Data are expressed as the mean ± SD (n = 3, *p < 0.01, **p < 0.05 by t-test). Representative data from two independent experiments are shown. e Result of limiting dilution BMT. A log-fraction plot of the limiting dilution model is shown. The slope of the line is the log-active cell fraction. The dotted lines give 95% confidence intervals (n = 5). The data point with zero negative response at dose 20,000 is represented by a downward-pointing triangle. Estimated numbers of repopulating cells are also shown

