Fig. 5.
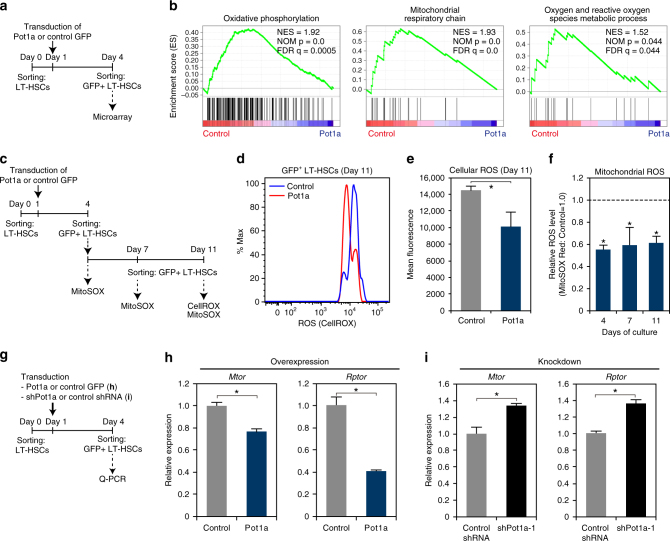
Effect of exogenous Pot1a on ROS production in LT-HSCs in culture. a Schematic of the microarray analysis. b GSEA plots demonstrating enrichment levels of indicated gene sets in control control-GFP versus Pot1a-transduced LT-HSCs. NES, NOM p value, and FDR are indicated. c Schematic of the measurement of ROS in LT-HSCs. d Intracellular ROS levels in control-GFP (blue) and Pot1a-transduced (red) LT-HSCs. Representative FACS profiles of CellROX in GFP+ LT-HSCs are shown. e Mean fluorescence level. Data are expressed as the mean ± SD (n = 5, *p < 0.01 by t-test). Representative data from two independent experiments are shown. f Relative mean fluorescence level of MitoSOX in the GFP+ LT-HSCs on days 4, 7, and 11 of culture. Mean fluorescence level of MitoSOX in control-GFP-transduced LT-HSCs was set to 1.0. Data are expressed as the mean ± SD (n = 6: day 7, n = 12: day 7, n = 3: day 11, *p < 0.01 by Tukey’s test). g Schematic of the measurement of ROS in LT-HSCs upon overexpression or knockdown of Pot1a. h Expression of Mtor and Rptor in Pot1a-overexpressing LT-HSCs. Data are expressed as the mean ± SD (n = 4, *p < 0.01 by t-test). i Expression of Mtor and Rptor in Pot1a knockdown LT-HSCs. Data are expressed as the mean ± SD (n = 4, *p < 0.01 by t-test)

