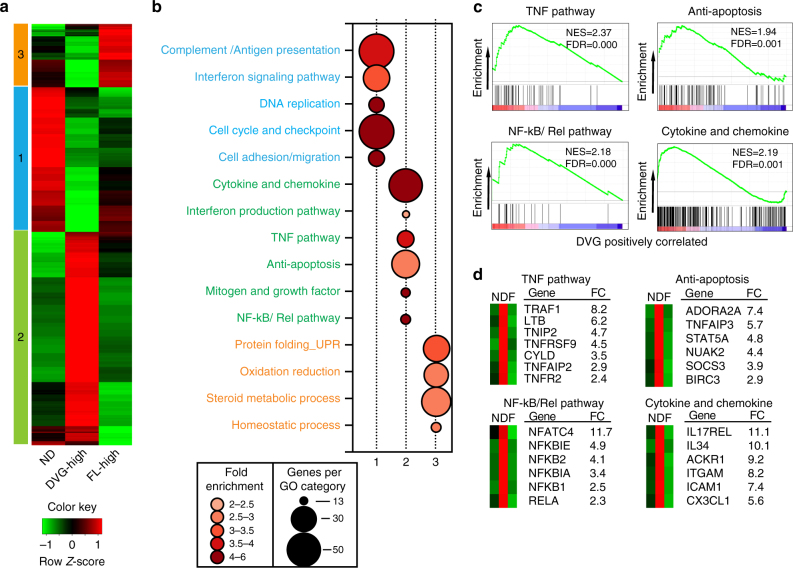
Fig. 4.
Transcriptional profiling of cells sorted based on DVG and FL-gSeV abundance identified distinct pro-survival pathways in DVG-high cells. a Hierarchical clustering and heatmap representation of 1800 genes differentially regulated among ND, FL-high, and DVG-high populations sorted from SeV HD-infected A549 cells at 24 h post infection. Color based on row Z-score. Three clusters of distinctly upregulated genes in each of the sorted sub-populations are indicated. b Bubble chart showing Gene Ontology (GO) enrichment analysis. Bubble size indicates the number of genes associated with each term. Bubble color intensity indicates fold enrichment of GO terms overrepresented in that cluster of genes. Pathways upregulated in each cluster were color-coded as blue (Cluster 1), green (Cluster 2) and orange (Cluster 3). c GSEA enrichment plots for four selected pathways differentially regulated in the DVG-high cells compared with others. Normalized enrichment scores (NES) and false discovery rate (FDR) are indicated. d Selected genes from each GSEA signature panel shown in c. Average fold change (FC) between DVG-high and FL-high cells is shown. N = ND, D = DVG-high, and F = FL-high in the mini-heatmaps shown in the left side of each graph. See also Supplementary Fig. 4

