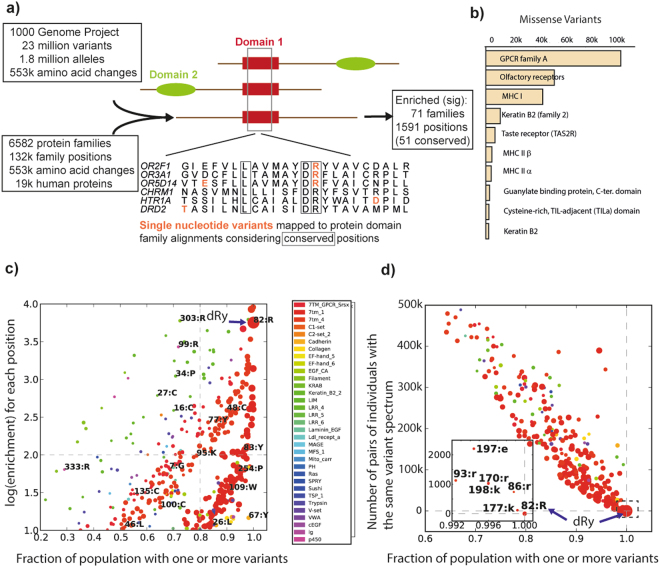
Figure 1.
(a) Schematic showing how variant data are combined with aligned protein domains (coloured shapes; top), to identify equivalent alignment positions (below; boxes show conserved) and variants (red). (b) Protein domains having the most missense variants within the 1000 genomes population. (c) Enrichment at each significantly enriched alignment position (Q < = 0.01, ≥10 members with variants, log-odds > = 1) vs. the fraction of the total 1000 genomes population having at least one of these variants. Labels give Pfam alignment position and the most common residue (uppercase = conserved); colours denote Pfam families (7tm_1 and 7tm_4 are GPCR family A containing the DRY motif); diameter is proportional to variant count. (d) as for c) but where the y-axis is the number of times pairs of individuals have the identical spectrum of variants at a protein family position (i.e. dRy is the only position where no two individuals have the same spectrum, hence a value of zero).

