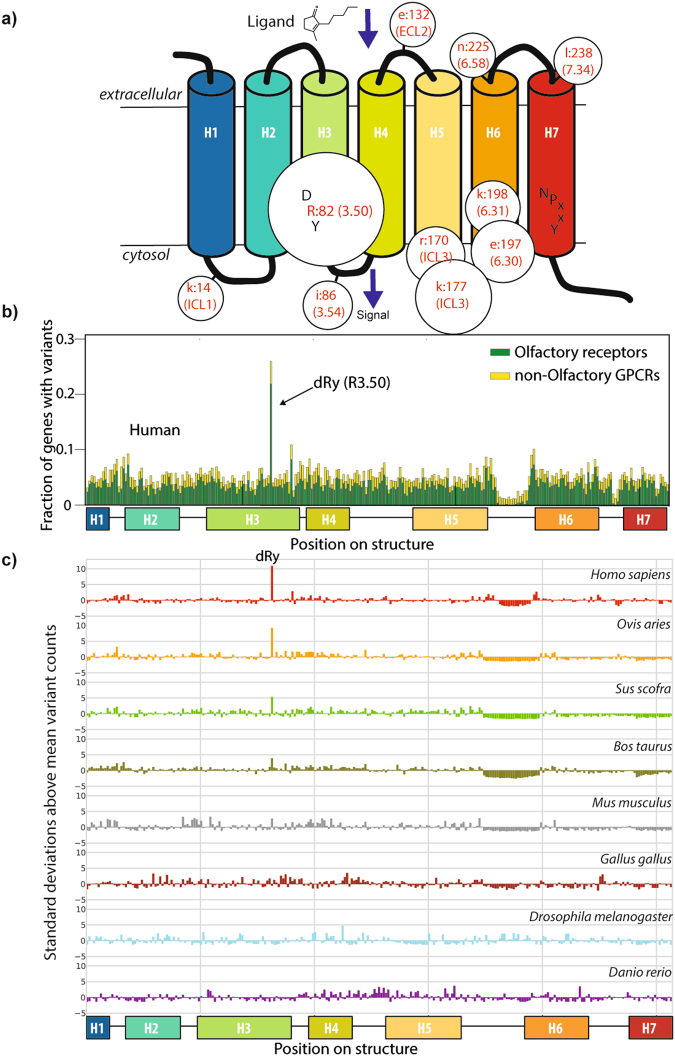
Figure 2.
(a) Cartoon showing GPCR positions with the most variants; size is proportional to variant count, numbers denote Pfam 7tm_1 alignment positions, with the Ballesteros/Weinstein scheme given in parantheses. (b) Fraction of GPCR genes containing variants at each domain position showing the proportion in OR (yellow) and non-OR (green) receptors highlighted. (c) Plots of the number of the standard deviations above (positive) or below (negative) the mean for each position within GPCR family A for eight species within Ensembl variations56 having sufficient data for the analysis. The mean and standard-deviation are specific for each species and considering only variants within GPCR family A. The dip in the plot (between H5 and H6) is due to gaps within the alignment (i.e. fewer data points overall within this region).

