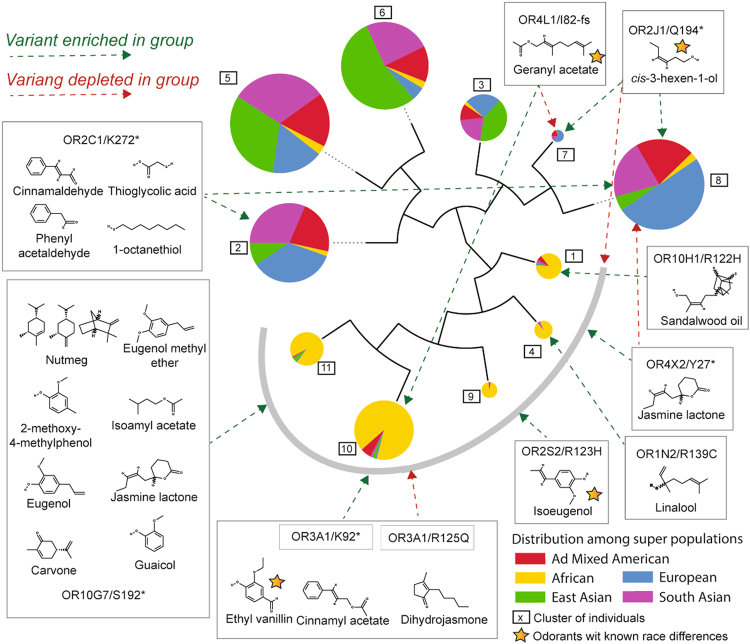
Figure 4.
Hierarchical clustering dendrogram of 2,504 individuals based on OR loss-of-function (dRy, stop-gain or frameshift) fingerprint distances. Clustered pie charts showing the proportions of sub-populations containing the variants; radii are proportional to population; colours show 1000 Genome super-population composition. Loss-of-function variants are shown as positional changes given as wild-type residue, position and change, where * denotes stop-gains and fs denotes frameshifts (those labelled are dRy variants). Only variants enriched/depleted (log odds ≥ 0.6 or ≤ −0.6) in one 1000 Genomes super-population relative to the others are shown. Variants are shown in boxes together with known ligands for the receptors17 and arrows show if they are enriched (green) or depleted (red) in a particular super-population. The grey curve around the mostly African (yellow) clusters is for clarity; arrows touching this line indicate enrichment or depletion in all clusters.

