Figure 7.
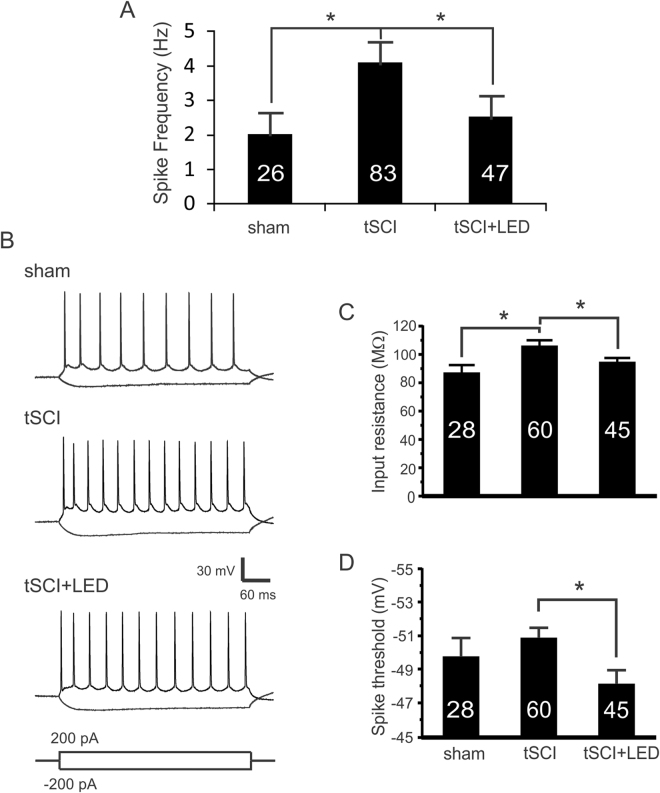
Optogenetic stimulation normalizes enhanced spontaneous firing and excitability of cortical layer V pyramidal neurons after tSCI. (A) Spike frequency of cortical layer V pyramidal neurons at 10 days after tSCI was significantly higher than that of the sham group, and was reduced after 5 days of optogenetic stimulation (sham: 2.0 ± 0.6 Hz; tSCI: 4.1 ± 0.6 Hz, tSCI + LED: 2.5 ± 0.6 Hz. *: p < 0.05, Mann-Whitney test). Numbers in the bars indicate neuron numbers in each group; same for the following figures. (B) Representative traces of AP firing of layer V pyramidal neurons in response to current injections. (C) Neuronal input resistance in tSCI group was higher than that of the sham group, but after optogenetic stimulation it was significantly lower than the tSCI group (sham: 86.6 ± 6.0 MΩ; tSCI: 105.5 ± 4.6 MΩ; tSCI + LED: 94.3 ± 3.3 MΩ. p < 0.05 when compared between sham and tSCI groups, and between the tSCI and tSCI + LED groups, One-way ANOVA followed by Bonferroni test). (D) Optogenetic stimulation resulted in a more positive active potential threshold than the tSCI group (−49.8 ± 1.1 mV, −50.9 ± 0.6 mV, −48.2 ± 0.8 mV in sham, tSCI, and tSCI + LED groups respectively. *p < 0.05 when compared between tSCI and tSCI + LED groups, One-way ANOVA followed by Bonferroni test).

