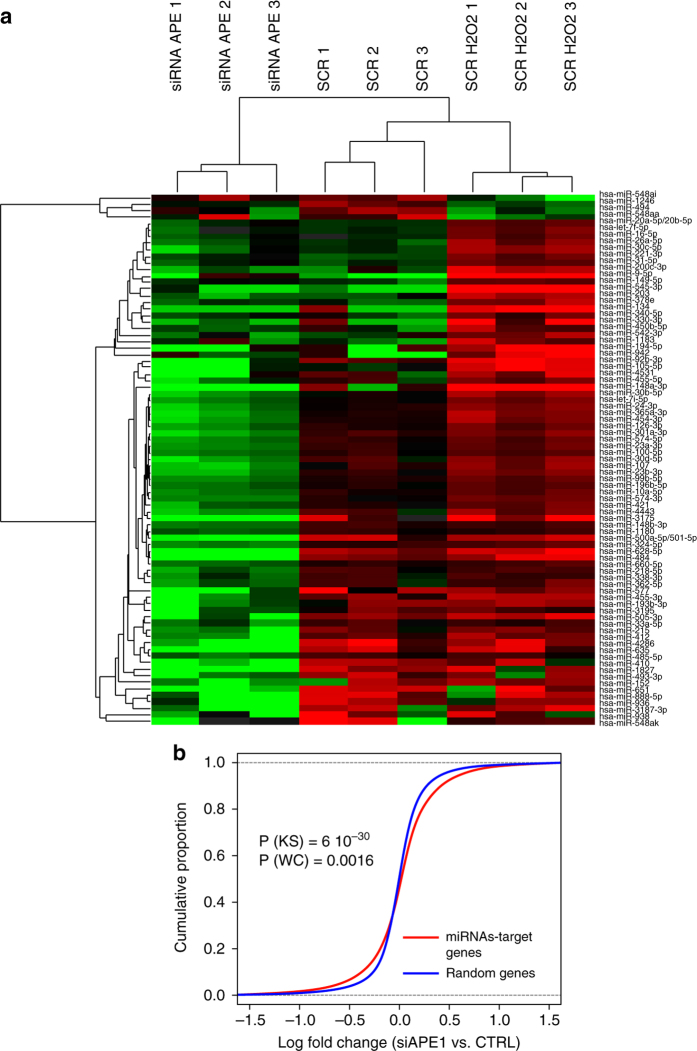
Fig. 1.
miRNA profiling of H2O2-treated and APE1-knocked down HeLa cells. a Hierarchical-clustering analysis showing miRNAs differentially expressed in HeLa cell clones stably transfected with scrambled siRNA control (SCR), with an APE1 siRNA (siAPE) or SCR after stimulation with 1 mM H2O2 for 15 min. The heatmap diagram shows the centered miRNA expression values in logarithmic scale across the three groups of samples. b Empirical cumulative distribution function (ECDF) curves for expression changes (log fold change) of miRNAs-target genes (red line) vs. those of random mRNAs (blue line). Statistical significance of the difference between ECDFs is indicated (P-value from Kolmogorov–Smirnov (KS) test and Wilcoxon (WC))

