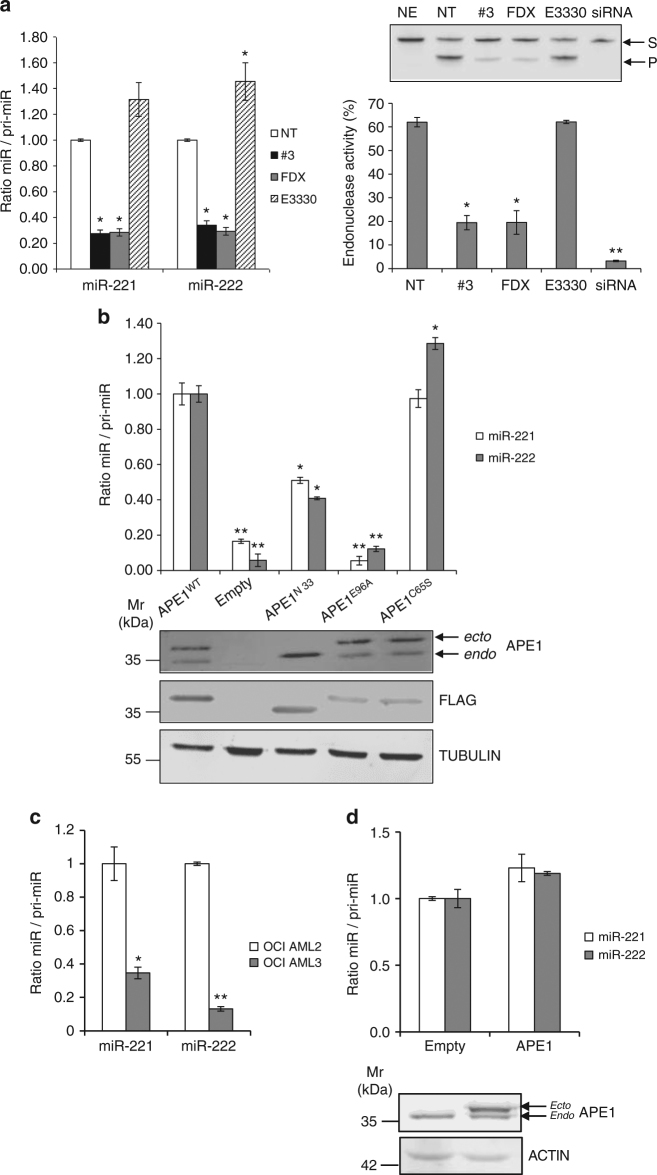
Fig. 3.
Inhibition of APE1 endonuclease activity negatively affects miR-221 and miR-222 processing. a Mature miR-221 and miR-222 were measured by qRT-PCR in HeLa cells treated with 20 µM compound #3, 40 µM fiduxosin (FDX) and 100 µM E3330 for 24 h, respectively. Mature miRNAs were normalized to RNU44 and expressed relative to GAPDH-normalized pri-miR-221/222. Right, AP-site incision activity of total cell extracts from HeLa cells treated with the indicated APE1 inhibitors or HeLa cells silenced for APE1 (siRNA). siRNA cell extracts were used as negative control. The histogram indicates the percentage conversion of an AP site-containing DNA substrate (S) to the incised product (P). Data are expressed as mean ± SD of three technical replicates from two independent assays. A representative image of the denaturing polyacrylamide gel of the enzymatic reactions is shown. NE no cell extract, NT non-treated cells. Asterisks represent a significant difference with respect to control (NT).*P < 0.05, **P < 0.001, Student’s t-test. b Mature miR to pri-miR ratios in HeLa cell clones silenced for the endogenous APE1 expression and transiently transfected with expression plasmids for FLAG-tagged, siRNA-resistant APE1 mutants APE1WT, APE1NΔ33, APE1E96A, and APE1C65S. Mature miR-221 and miR-222 levels were measured by qRT-PCR analysis, normalized to RNU44, and expressed as relative to GAPDH-normalized pri-miR-221/222. Asterisks represent a significant difference with respect to control (SCR). *P < 0.05, **P < 0.001, Student’s t-test. Below, western blotting analysis showing HeLa cell clones silenced for endogenous APE1–protein (endo) and re-expressing ectopic APE1–FLAG-tagged mutants (ecto). c miR-221 and miR-222 expression levels evaluated by qRT-PCR analysis of OCI/AML-2 and AML-3 cells lines. OCI/AML2 cells represent the control expressing a wild-type NPM1 protein, which accumulates within nucleoplasm and nucleoli. Histograms show the ratio between mature miRNAs relative to their GAPDH-normalized precursors. Asterisks represent a significant difference with respect to control (OCI/AML-2).*P < 0.05, **P < 0.001, Student’s t-test. d miR-221 and miR-222 expression levels evaluated by qRT-PCR analysis of HeLa cells overexpressing APE1 by transient transfection of APE1–FLAG-expressing plasmid. Histograms show the ratio between mature miRNAs relative to their GAPDH-normalized precursors. Below, western blotting analysis showing HeLa cells transfected with ectopic APE1 FLAG-tagged plasmid

