Fig. 6.
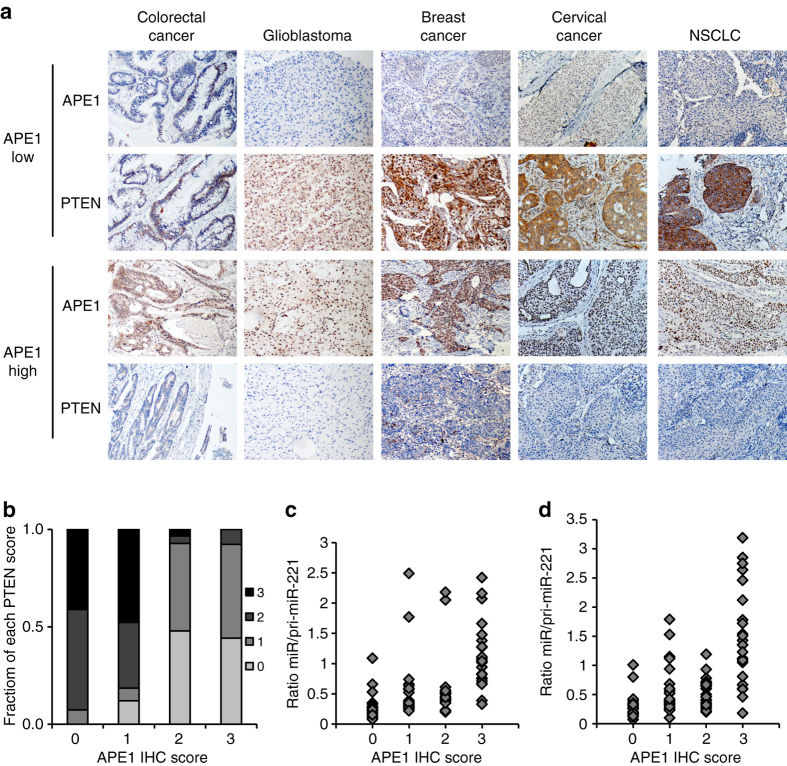
Correlative expression of APE1 and miR-221/222 with PTEN in a cohort of human cancer specimens. a APE1 and PTEN protein expression were determined by IHC assay and the representative images of both APE1 and PTEN were shown. PTEN expression significantly increased in tumor tissues showing poor APE1 expression, while was suppressed in tumor tissues showing high APE1 expression. b Bar graph showing the percentage of each score level of PTEN in 0, 1, 2, and 3 score level of APE1. Data were categorized as follow: (i) score 0, no expression in tumor cells; (ii) score 1, faint/barely perceptible partial expression in <10% of tumor cells; (iii) score 2, weak to moderate expression in >10% of tumor cells; (iv) score 3, strong expression in >10% of tumor cells. c and d Scattered plots showing distribution of miR to pri-miR ratios for miR-221 and miR-222 in each score level of APE1–protein staining, respectively

