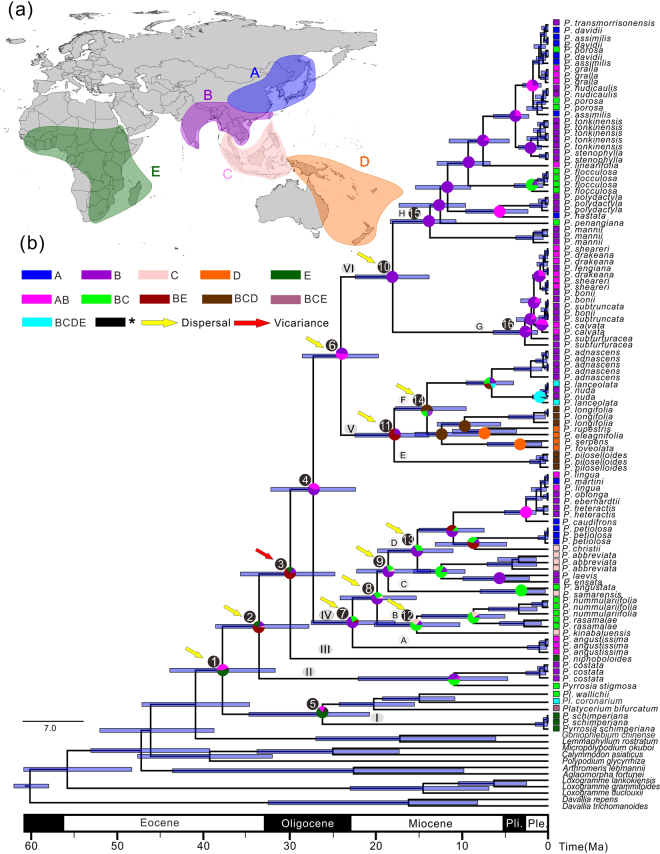
Figure 3.
Global biogeographical patterns of Pyrrosia s.l. (a) Map showing five biogeographical areas in colors as defined in this study. (b) Schematic chronograms (maximum clade credibility topology) based on cpDNA data using uniform priors obtained from BEAST. The geological time scale (60 Ma–present) is shown at the bottom. Node numbers and mean ages refer to Table 2. Blue bars represent 95% highest posterior density of node age. Color-coded pie diagrams represent the probabilities of different states of ancestral area reconstruction (AAR) based on the dispersal–extinction–cladogenesis (DEC) model in RASP. Arrowheads represent the possible split events inferred in RASP. Biogeographical area abbreviations: A, eastern Asia (including central, eastern and northeastern China, Korea Peninsula, southern Japan and Far East); B, southern Asia, the Indo-China Peninsula and southwestern and southern China; C, Malesia (including Malaysia, Indonesia, and the Philippines); D, Australasia (including Australia, New Guinea, New Zealand, and the South Pacific islands); E, Africa (including Madagascar). Geological epoch abbreviations: Pli., Pliocene; Ple., Pleistocene. The spatial data of Fig. 3a was freely downloaded from http://www.diva-gis.org/Data, the base map was generated by ArcGIS v.9.3 (http://www.esri.com/software/arcgis/arcgis-for-desktop), and Fig. 3a was drawn by CorelDRAW v. x 8 (http://www.coreldraw.com/en/product/graphic-design-software/).

