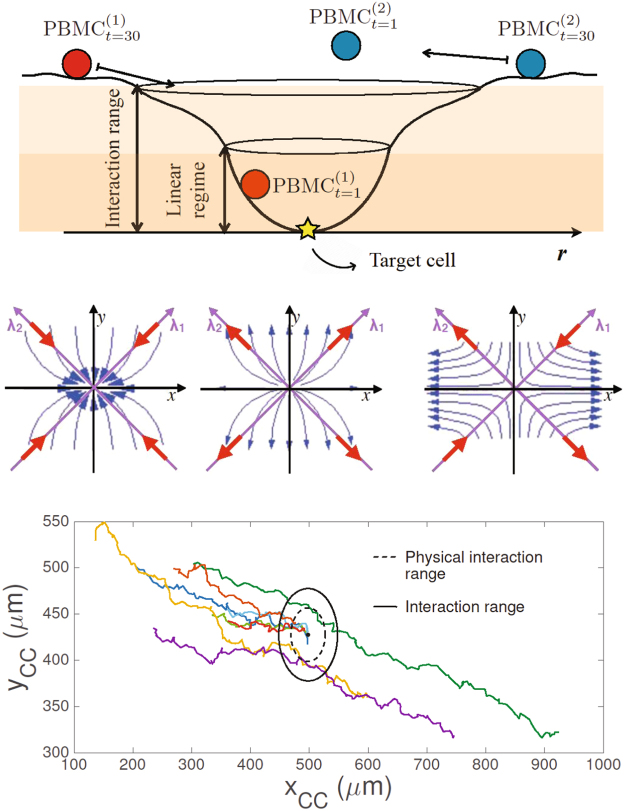
Figure 6.
Upper panel: representative picture of the landscape generated by a tumor cell (i.e., the attractor) and possible dynamics of the immune cell. PBMC, attracted by the target TC, collapses in the minimum of the linearization range inside the interaction range. In the case of a stable trajectory (associated to the red sphere), any small perturbation at time 0 will not cause the escape of the particle from the minimum at time 1. On the contrary, metastable trajectories (associated to the blue sphere) are sensitive to small perturbations and the particle can easily escape from the local equilibrium. Central panel: plots of different possible immune cells dynamics. The panels resume the three different possible outcomes of the PBMC convergence to the TC attractor (stable, unstable and metastable dynamics), where the eigenvectors, labeled by λ, are the natural base built as a linear combination of λ1 and λ2. Bottom panel: real tracks of immune cells attracted by one tumor cell. The position of the tumor cell corresponds to the center of the black circle. The radius of the dashed circle represents the physical interaction range given by the sum of the mean diameter of PBMC (∼9 μm) and TC (∼20 μm). The radius of the solid circle represents the interaction range of the selected TC, (∼50 μm). The colored lines represent the tracks of the immune cells that approach the tumor cell considered. Each color corresponds to a different immune cell.

