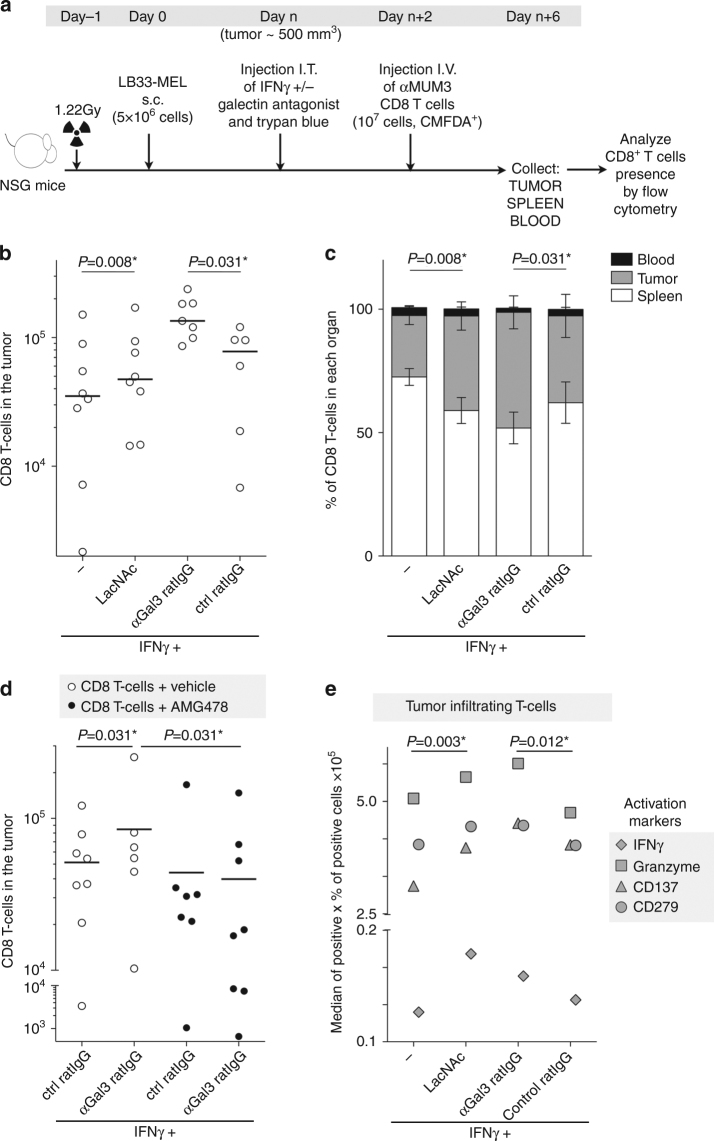
Fig. 7.
Anti-galectin treatments boost CD8+ T-cell infiltration in the tumor. a Scheme showing the protocol for analysis of T-cell infiltration in the tumor. s.c. stands for subcutaneous injection, I.T. for intratumoral injection, and I.V. for intravenous injection. The doses used for I.T. were IFNγ 50 ng per tumor, LacNAc 0.1 μmol per tumor, and antibodies 100 ng per tumor. b Absolute numbers of CD8+ T cells infiltrating the tumors of mice treated as explained above. Each point represents one mouse (average of quadruplicates). Lines represent the mean value for each treatment. Wilcoxon matched-pairs signed rank test. P-values are shown in the graph. Absolute numbers of CD8+ T cells in the spleens are shown in Supplementary Fig. 9a; n = 6–8 mice per group. c Percentage of CD8+ T cells found in the different compartments. Bars represent the mean ± SEM of 6–8 mice per group. Wilcoxon matched-pairs signed rank test. P-values regarding tumor and spleen proportions are shown in the graph. d Absolute numbers of CD8+ T cells infiltrating the tumors of mice treated or not with the CXCR3 inhibitor AMG478. Each point represents one mouse (average of quadruplicates). Lines represent the mean value for each treatment. Wilcoxon matched-pairs signed rank test. P-values are shown in the graph. Absolute numbers of CD8+ T cells in the spleens are shown in Supplementary Fig. 9a; n = 6–8 mice per group. e Global activation status of tumor infiltrating CD8+ T cells. Each symbol represents the mean value for the different activation markers (n = 6–8 mice per group). Wilcoxon matched-pairs signed rank test. P-values are shown in the graph. Representative histograms are shown in Supplementary Fig. 11

