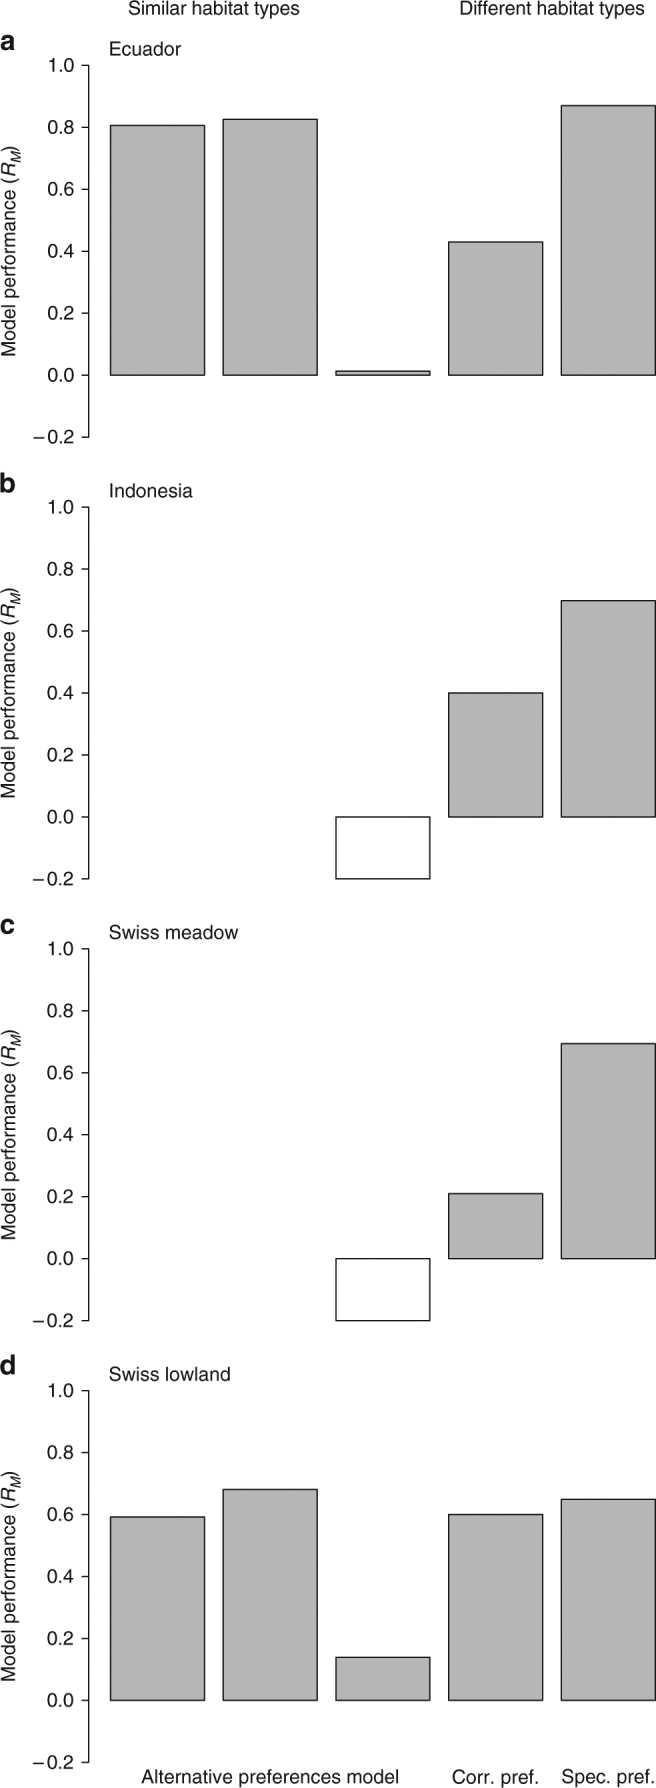
Fig. 4.

Performance of three models based on random species encounter at the group level. Model performance is measured by , which rescales the group-level likelihood of a model to the group-level likelihoods of the random encounter and complete characterisation models (see Eq. 4 in Methods section). Open bars indicate negative values and are capped for display. Left-to-right: predicting between similar habitat types using the alternative preferences model for Ecuador (a, pasture-to-rice then rice-to-pasture) and Swiss lowland (d, adjacent-to-connected then connected-to-adjacent); then predicting between different habitat types (unmodified-to-modified) using the alternative preferences, correlated preferences and specified preferences models for all four data sets. Indonesia (b) and Swiss meadow (c) data sets did not contain sufficient interaction data to test predictions between similar habitat types. Notice the high values of for the alternative preferences model when predicting between similar habitat types, but the low values when predicting between different habitat types. Also notice the improvement in when using the correlated preferences and specified preferences models for predicting weighted network structure in modified habitat types
