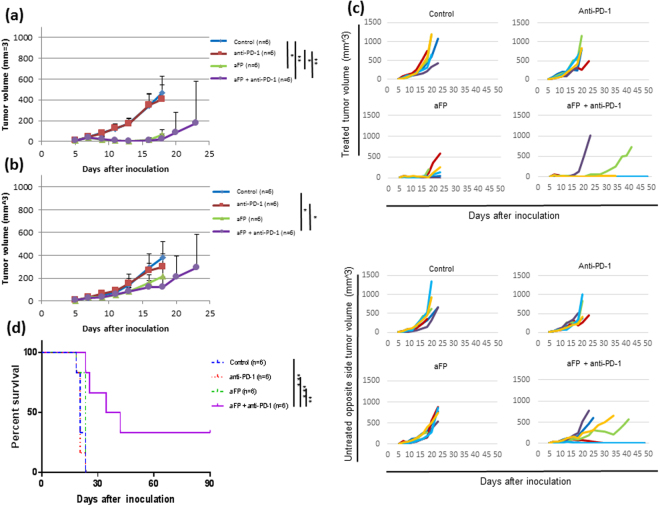
Figure 4.
Tumor Volume and Survival Curves after Treatment in the Two Tumor Mouse Model. To investigate whether aFP treatment could induce systemic anti-tumor immunity, we established a mouse model which has one tumor on each hind leg with the aFP-treated tumor on the left leg and observed the growth of both tumors. aFP laser irradiation was performed 7 days after tumor inoculation. Anti-PD-1 blocking antibodies were administered intraperitoneally at a dose of 200 µg per mouse on days 7, 9, 11, 13, and 15 after tumor cell inoculation. (a) Average of tumor volume curves on the treated legs of mice in the control, anti-PD-1, aFP and aFP + anti-PD-1 groups after tumor inoculation. (b) Average of tumor volume curves on the untreated contralateral legs of mice in the control, anti-PD-1, aFP and aFP + anti-PD-1 groups after tumor inoculation. (c) Individual tumor volume curves in the control, anti-PD-1, aFP and aFP + anti-PD-1 groups after tumor inoculation. (d) Kaplan-Meier survival curves of mice receiving tumor inoculation. The significance values for the difference between the survival curves are: Control vs. aFP + anti-PD1: P < 0.005, Anti-PD-1 vs. aFP + anti-PD1: P < 0.005, aFP vs. aFP + anti-PD1: P < 0.01. The bars represent SD. *P < 0.05, **P < 0.01, ***P < 0.005.

