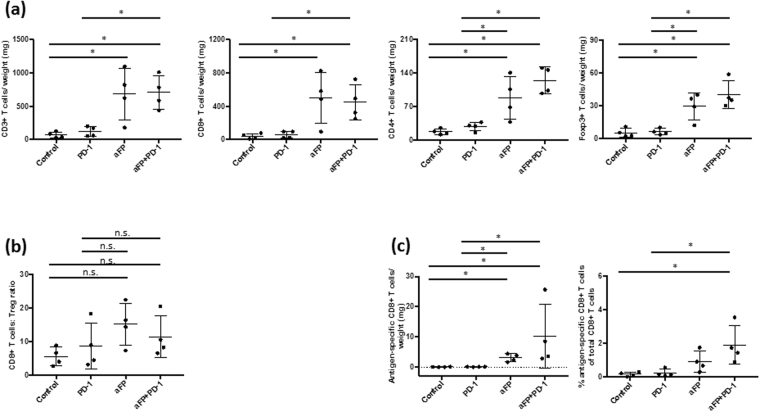
Figure 5.
Flow Cytometric Analysis for Tumor Infiltrating Lymphocytes 12 Days after aFP Treatment in the Two Tumor Mouse Model. Flow cytometry analysis was performed 12 days after aFP treatment to investigate the number of CD3+, CD4+, and CD8+, epitope specific CD8+ T cells and Tregs expressing CD4, and Foxp3 inside the untreated contralateral tumor when the untreated contralateral tumor in the aFP + anti-PD-1 group shrank. (a) Proportion of CD3+, CD8+ and CD4+ T cells and Treg normalized to tumor weight. (b) Ratio of CD8+ T cells to Tregs (CD4+ Foxp3+). (c) Proportion of antigen specific CD8+ T cells normalized to tumor weight and the percentage of antigen specific CD8+ T cells of total CD8+ T cells. The bars represent SD. *P < 0.05.

