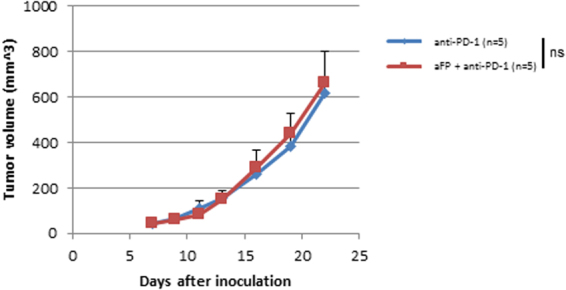
Figure 6.

Tumor Volume Curves after Treatment in the Two Tumor Mouse Model with Mismatched Tumors, CT26WT and 4T1. To investigate whether the shrinkage of the untreated contralateral tumor in the aFP + anti-PD-1 group was due to antigen specific immunity induced by aFP or not, we performed experiments with two groups of mice that each had two mismatched tumors, CT26WT in left leg and 4T1 (murine mammary carcinoma) in right leg. The aFP group was treated with only anti-PD-1 inhibitor and the aFP + anti-PD-1 group was treated with aFP treatment in left leg (CT26WT) and anti-PD-1 inhibitor. The graph shows tumor (4T1) volume curves on untreated right leg of mice in the anti-PD-1 and aFP + anti-PD-1 groups after tumor inoculation. The bars represent SD. ns, not significant.
