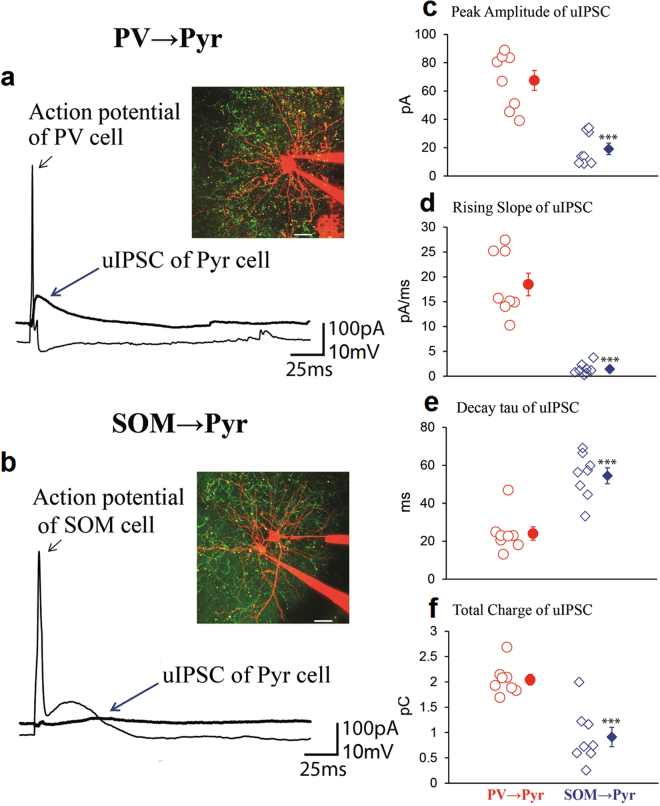
Figure 1.
Unitary IPSC (uIPSC) of Pyr cells evoked by action potentials of PV or SOM neurons in vivo. (a) A PV neuron generated action potential which induced uIPSC in a Pyr cell, as indicated by arrows. Arrangement of the two cells and electrodes is shown in inset. The distance between the soma of the two cells was 26 μm. The cell bodies and dendrites are visualized by Alexa. Green signals mostly represent dendrites of other PV cells which expressed ChR2. Scale at bottom, 20 μm. (b) A SOM neuron generated action potential which induced uIPSC in a Pyr cell, as indicated by arrows. Other conventions are the same as in (a). (c–f) Peak amplitude, rising slope, decay tau and total charge of uIPSCs of 8 Pyr cells evoked by action potentials of PV neurons (left) and those of another 8 Pyr cells evoked by action potentials of SOM neurons (right). Filled symbol with vertical bar in the right represents means ± SEM. In a few cases the value of SEM was very small so that it did not appear outside the symbol. Triple asterisks indicate that the difference in the mean between the left and right columns is statistically significant at p < 0.001 (unpaired t-test).

