
Figure 6.
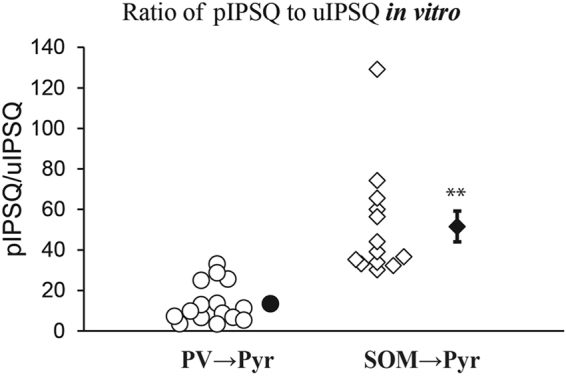
Ratio of the total charge of pIPSC (pIPSQ) to that of uIPSC (uIPSQ) in slice preprations. Each symbol represents the ratio value for the PV → Pyr cell connection (left column) and of SOM → Pyr cell connection (right column) obtained in the in vitro conditions. Filled symbol with vertical bar in the right represents means ± SEM. In the left column the value of SEM was very small so that it did not appear outside the symbol. Double asterisks indicate that the difference in the mean between the left and right columns is statistically significant at p < 0.01 (unpaired t-test).