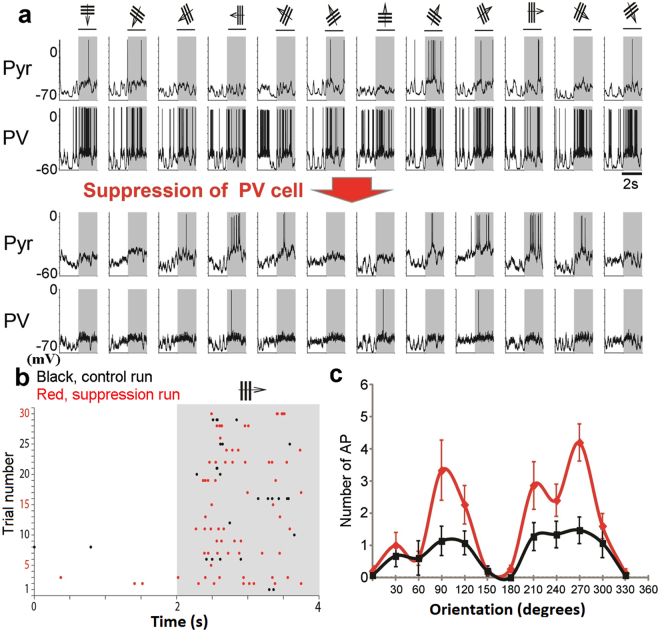
Figure 7.
Suppression of single PV neurons enhances visual responses of postsynaptic Pyr cells. (a) Membrane potentials of a Pyr cell (top row) and a presynaptic PV neuron (second row) to moving grating stimuli as shown at top. Stimuli were given in the period indicated by hatched area. Membrane potentials of the Pyr cell and the PV neuron during suppression of the latter neuron are shown in the third and fourth rows. (b) Raster plot of action potentials of the Pyr cell before (black dots) and during (red dots) suppression of the PV neuron. (c) Orientation tuning curves of the visual responses of the Pyr cell before (black) and during (red) the suppression of the PV neuron. Vertical bars indicate mean ± SEM of number of action potentials (APs) in 15 responses at each orientation.

