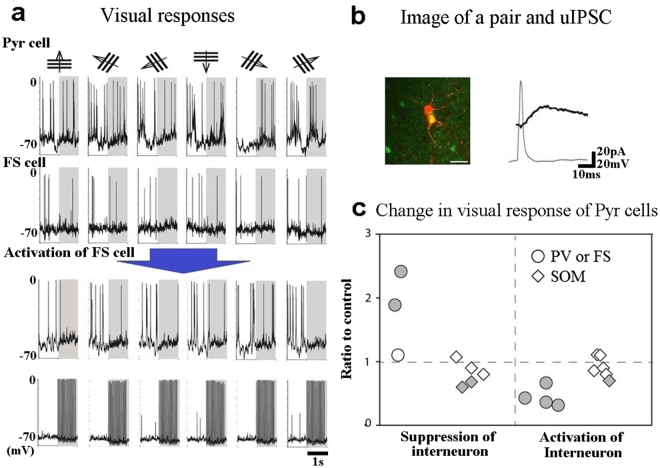
Figure 8.
Single PV neurons modify visual responses of postsynaptic Pyr cells while single SOM neurons mostly do not. (a) Membrane potentials of a Pyr cell (top row) and a presynaptic interneuron of the FS type (second row) to moving grating stimuli as shown at top. Stimuli were given in the period indicated by hatched area. Membrane potentials of the Pyr cell and the FS cell during activation of the FS cell are shown in the third and fourth rows. In the fourth row injection of depolarizing current induced repetitive generation of action potentials which are truncated. Scales at the right end of the bottom row apply all rows. (b) Single action potentials of the FS cell and evoked uIPSCs of the Pyr cell are superimposed. Scales of 20 pA and 20 mV apply to synaptic currents of the Pyr cell and membrane potentials of the FS cell, respectively. Arrangement of the two cells is shown in inset. Scale at bottom, 20 μm. (c) Changes in visual responses of postsynaptic Pyr cells by suppression (shown in the left side) and activation (right side) of presynaptic interneurons of the indicated types. Ratios to the control values were calculated by the number of action potentials or the mean value of depolarization during visual stimulation. The statistical analysis with t-test or Mann–Whitney U test was made for each pair by comparing the values obtained during suppression or activation of presynaptic interneurons with those before the presynaptic manipulation. Cells that showed the statistically significant change are indicated by shaded symbols. The mean for the PV/FS → Pyr cell pairs was 1.8 ± 0.4 in the suppression experiment and 0.4 ± 0.01 for the activation experiment. The mean for the SOM → Pyr cell pairs was 0.8 ± 0.1 in the suppression experiment and 0.9 ± 0.1 for the activation experiment. These data were obtained from 4 PV-ChR2-YFP, 3 VGAT-ChR2-YFP and 11 SOM-ChR2-YFP mice.

