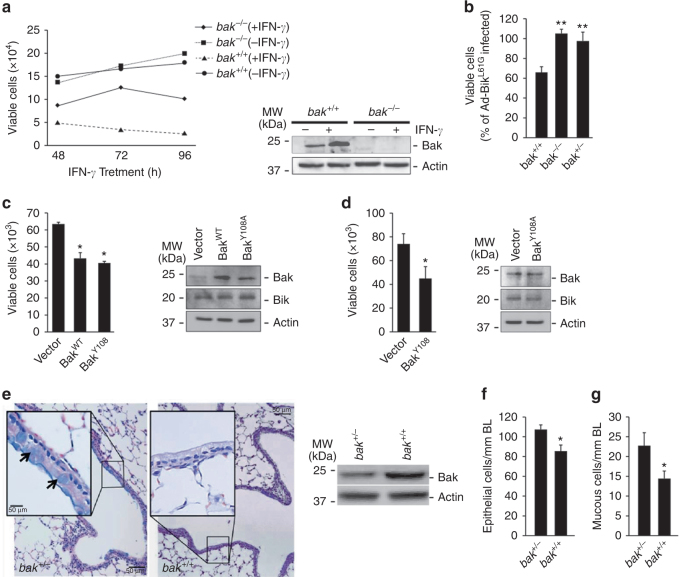
Fig. 2.
Bak mediates IFN-γ- or Bik-induced cell death and resolution of ECH and MCM during prolonged exposure to allergen. a MAECs isolated from bak −/− and bak +/+ mice treated with 50 ng/ml murine recombinant IFN-γ or left untreated as controls and viable cells quantified 24, 48, and 72 h later with Trypan blue. Protein lysates were analyzed for the expression level of Bak by western blot. b MAECs from bak +/+, bak −/−, and bak +/− mice were infected with 100 MOI Ad-Bik or Ad-BikL61G, and cell viability was quantified 24 h later. c MAECs from bak −/− mice were infected with empty vector or retroviral expression vector for BakWT or mutant constitutively activation competent form of Bak (BakY108A). Cells were collected and quantified by trypan blue exclusion assay and protein lysates were analyzed by western blotting. d MAECs from bak +/− mice were infected with empty vector and retroviral expression vectors for mutant constitutively activation competent form (BakY108A) of Bak. And 48 h later, cells were infected with 100 MOI Ad-Bik for 24 h. Cells were collected and quantified by trypan blue exclusion assay and protein lysates were analyzed by western blotting. e Representative micrographs of bak +/+ and bak +/− mice that were immunized with ovalbumin/alum on d 1 and 7, and were exposed to ovalbumin aerosols for 15 d. After killing, the lungs of each mouse were fixed and tissue sections were stained with Alcian blue/hematoxylin and eosin (AB/H&E) for quantification. Protein lysates of airway epithelial cells from bak +/− and bak +/+ mice were analyzed for Bak protein levels by western blotting. The numbers of epithelial f and mucous g cells per millimeter of basal lamina in bak +/+ mice but not in bak +/− mice at 15 d of exposure. Differences between two groups were assessed for significance by Student’s t test. ANOVA was used to perform pair-wise comparison of the data from more than two groups followed by Fisher least significant difference test. Error bars indicate ± SEM; (n = 8 mice per group). * = P < 0.05; ** = P < 0.01

