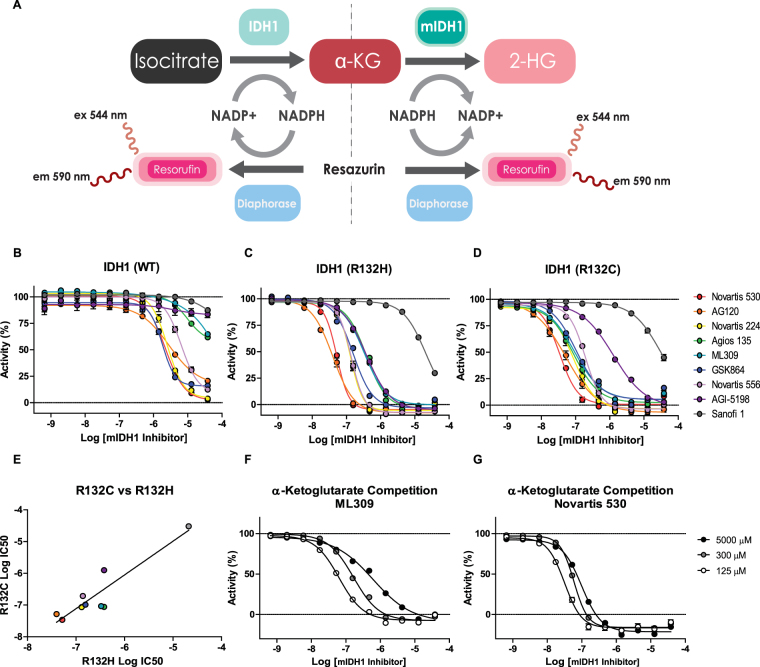
Figure 2.
Biochemical characterization of mIDH1 inhibitors. (A) Scheme of IDH1 and mIDH1 enzymatic reactions coupled to diaphorase for fluorescence detection. B-D, Dose-response analyses show the selectivity of mIDH1 inhibitors on the activity of purified (B) wild type IDH1, (C) R132H and (D) R132C mIDH1 enzymes (n = 3). (E) Comparison of mIDH1 inhibitors Log IC50 values on the activity of R132H and R132C mIDH1 enzymes show a strong correlation (R2 = 0.85, P value = 0.001). A large dose-response shift is shown for (F) ML309 compared to (G) Novartis 530 when using a range of concentrations of α-KG, suggesting ML309 acts as a competitive inhibitor (n = 3).

