Figure 7.
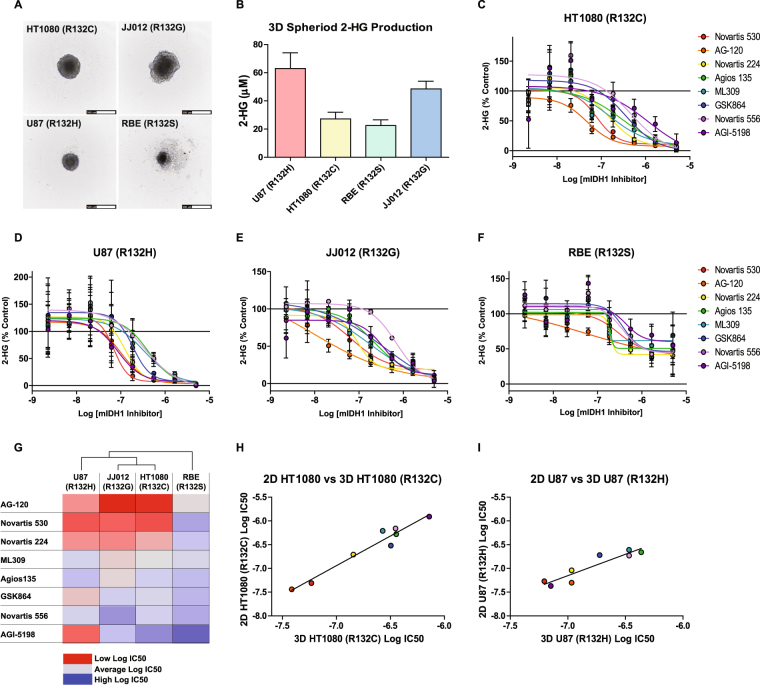
Activity of mIDH1 inhibitors in 3D cellular spheroids. (A) Representative images of 3D cellular spheroids of HT1080 (top left), JJ012 (top right), U87 (R132H) (bottom left), and RBE (bottom right) cells (scale = 500 µm). (B) Concentration of 2-HG in media produced from 3D cellular spheroid cultures after 4 days. Bars represent average and SD of 2-HG concentrations determined by MS analysis (n = 12). Dose-response analysis of mIDH1 inhibitor effects on 2-HG production in (C) HT1080(R132C), (D) U87(R132H), (E) JJ012(R132G), (D) RBE(R132S) 3D cellular spheroids (n = 3). (G) Heat map of Log IC50 values of mIDH1 inhibitors from the four 3D cellular spheroids. Cell line dendrogram was generated using the UPGMA clustering method with Euclidean distance measures. (H) Comparison of mIDH1 inhibitor Log IC50 values between 2D and 3D HT1080 (R132C) cellular assays show a strong correlation (R2 = 0.95, P value = < 0.0001). (I), Comparison of mIDH1 inhibitor Log IC50 values between 2D and 3D U87 (R132H) cellular assays show a strong correlation (R2 = 0.86, P value = 0.0009).

