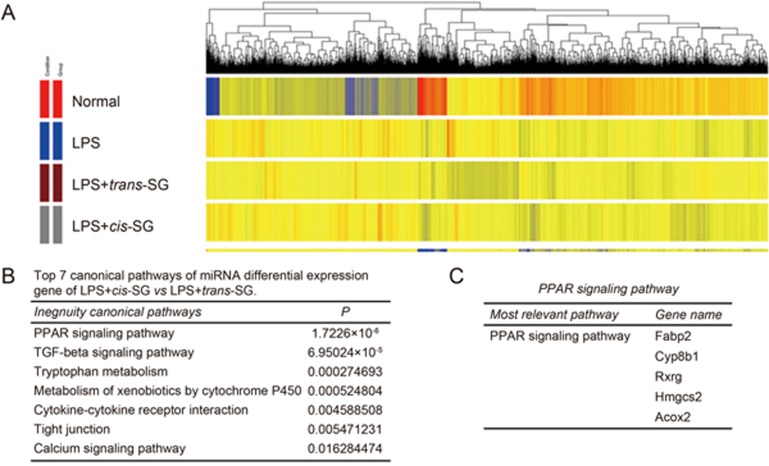
Figure 4.
Hierarchical clustering of LPS+cis-SG-induced gene expression. (A) Gene cluster analysis of microarray results (P<0.05; fold change>2.0) for the control, LPS, LPS+cis-SG and LPS+trans-SG groups. (B) The top 7 canonical pathways with differential gene expression in the LPS+cis-SG group vs the LPS+trans-SG group. (C) Expression of genes in the PPAR-γ signaling pathway.

