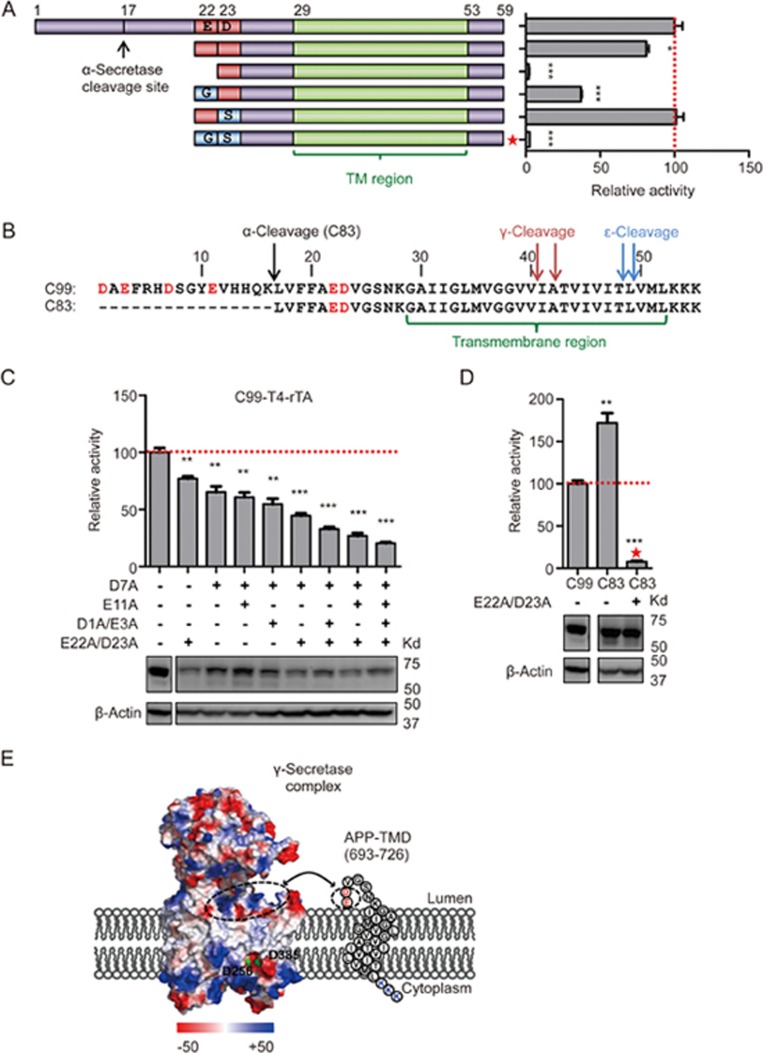
Figure 4.
N-terminal positive charge recognition model. (A) Cartoon illustration of the truncated C99 N-terminal mutations (left panel) and cleavage measurement by Epsilon-Cleavage assay of these substrates (right panel). Mutations that completely remove N-terminal negative charge by replacement with Gly or Ser are indicated by a red star. (B) N-terminal sequences of C99 and C83 with secretase cleavage sites and transmembrane domain are highlighted. Red letters indicate the N-terminal negatively charged residues. (C) Stepwise reduction of N-terminal negative charges by alanine mutagenesis. Cleavage was measured by the Epsilon-Cleavage assay. The relative protein expression is shown under each bar. (D) N-terminal negative charge study on C83. The red star indictes the construct in which N-terminal negative charge residues were replaced by GS amino acids. The relative protein expression is shown underneath. (E) Charge distribution of human γ-secretase (PDB code: 5A63) and cartoon illustration of a possible orientation of the APP minimum substrate. Negatively and positively charged residues are labeled with red and blue, respectively (see charge potential color code at bottom). PS1 catalytic aspartates are presented with green dots. Potential charge interaction areas are encircled with dashed lines. Error bars=SEM, n=3, P-values (two-tailed Student's t-test versus WT): *P<0.05; **P<0.01, ***P<0.001.

