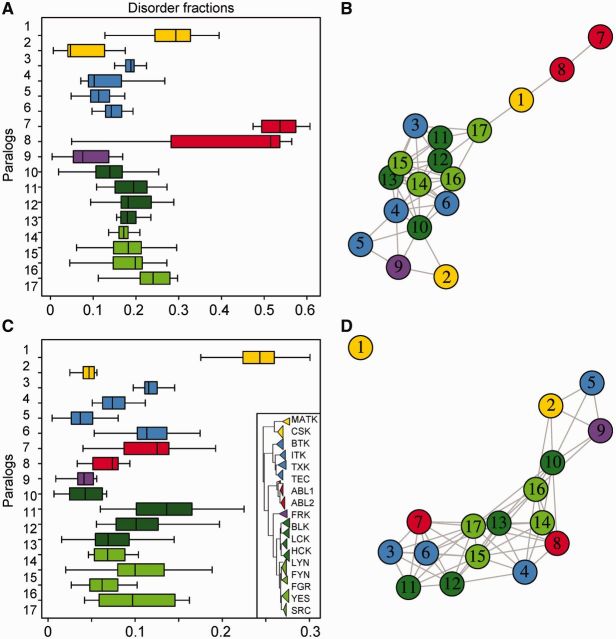
Fig. 5.—
Distribution of structural disorder across Tyrosine Kinase paralogs. Box plots of the distribution of structural disorder per paralogous group in (A) full-length proteins, and (C) in cassette domains (CDs). Paralogs are colored according to the family color scheme from figure 2 and numbered following the order of the cartoon tree shown in the box. Structural disorder is based on IUPred (Dosztányi, Csizmok, et al. 2005a) using a 0.4 cut-off to define binary states of order or disorder. (B and D) Statistical significance networks based on pairwise Mann–Whitney test with Bonferroni correction. Pairs with P value >0.05 are not significantly different in means and are shown as linked nodes: (B) significance inference of disorder distribution in full-length proteins and (D) in CDs.

