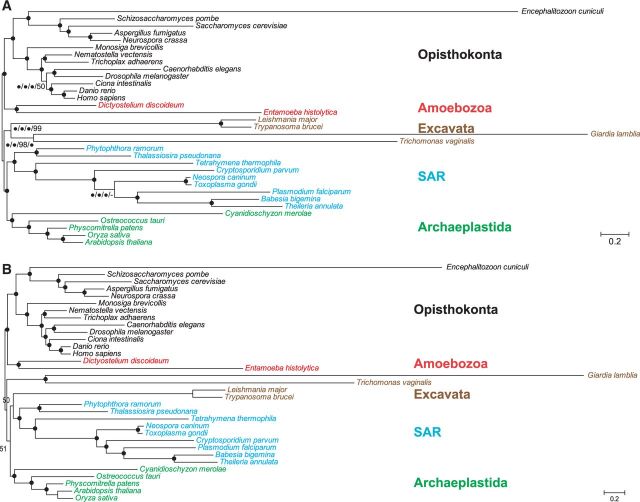
Fig. 1.—
Bayesian analyses of eukaryotic phylogeny with 33 representative species. (A) An unrooted Bayesian tree estimated from Euk-S33G68/138/78/139. (B) The tree estimated from Euk-S33G478. The topologies were estimated by Phylobayes using CAT model. The five eukaryotic supergroups are colored as following; red, Amoebozoa; black, Opisthokonta; green, Archaeplastida; blue, SAR; and brown, Excavata. Posterior Probability (PP) support values are shown for each nodes. Black dots indicate 100% PP support. In (A), black dots indicate nodes receiving 100% support from all four datasets. Dashes indicate the lack of support for the relationship from the relevant dataset(s).

