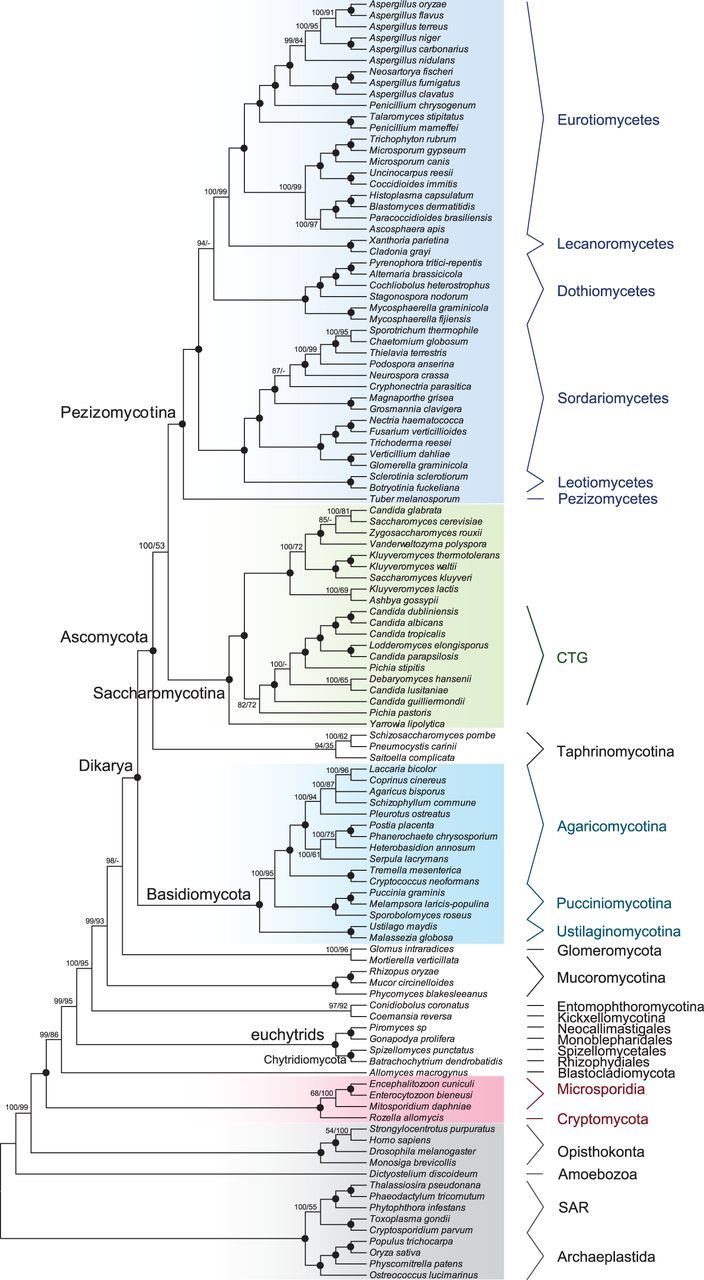
Fig. 5.—

Cladogram of 100 fungal species with 14 other eukaryotic species using 24 genes. The topology was estimated from Fun-S114G24 dataset by Phylobayes using CAT model. Black dots indicate 100% support from both Posterior Probability (PP) and bootstrap (BS) support from ML analysis (based on 100 replicates). Support values are only shown for nodes that do not receive 100% support. Dashes indicate lack of support from the ML analysis.
