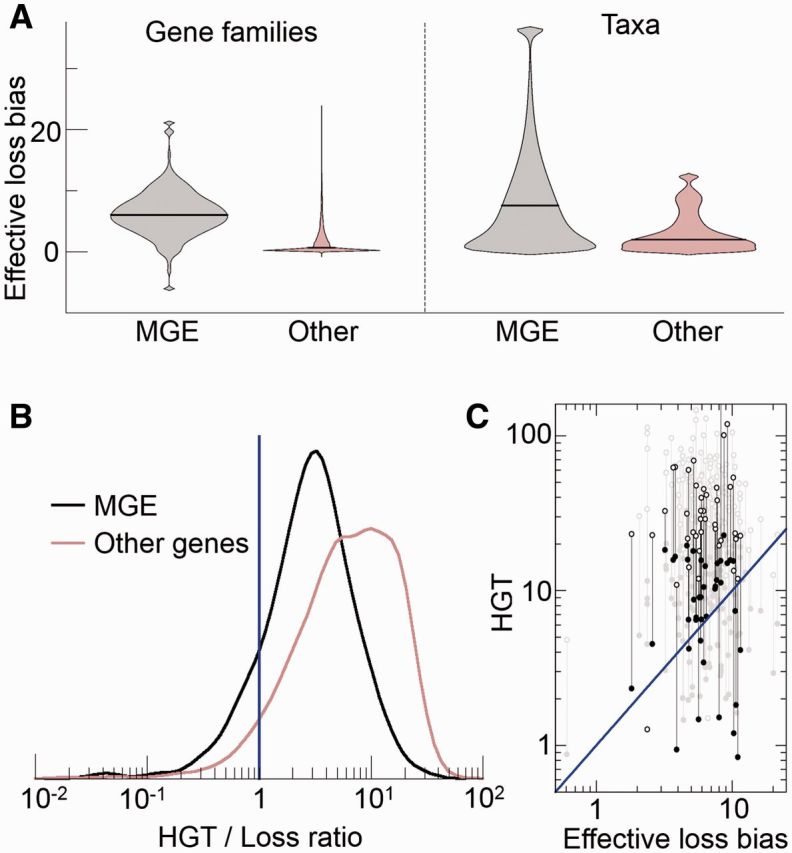
Fig. 2.—

Quantitative assessment of the effective loss bias (A) and the parasite persistence condition (B, C) in genomic data. (A) Violin plots with the distribution of effective loss biases affecting MGE (grey) and other genes (brown). Black, horizontal lines represent the median of the distribution. The plots on the left side were obtained by grouping genetic elements (ATGC COGs) with the same COG or Pfam assignment; in the plots on the right side, the elements are grouped according to the taxa (ATGC) they belong to. The loss bias is measured in relation to the fixation rate of point mutations per site. (B) Distribution of the ratio between the HGT rate and the effective loss bias for MGE (black) and other genes (brown). Both groups of genes show transfer-to-loss ratios significantly greater than one (vertical blue line), which is the critical ratio for parasite persistence (medians 2.9 and 6.6 for MGE and other, non-selfish genes, Wilcoxon sign test P-values < 10−20 in both cases). The distributions were smoothed using a Gaussian kernel. (C) The individual HGT rates and effective loss biases for every family of the mobilome. For clarity, the subset of the MGE unrelated to phages is plotted in black, whereas the more numerous phage-related elements are depicted in grey. Full and open circles correspond, respectively, to the conservative and upper bound estimates of the relative HGT rate (the distributions in A correspond to the geometric mean of both values). In B and C, the blue line indicates the critical HGT rate required for parasite persistence.
