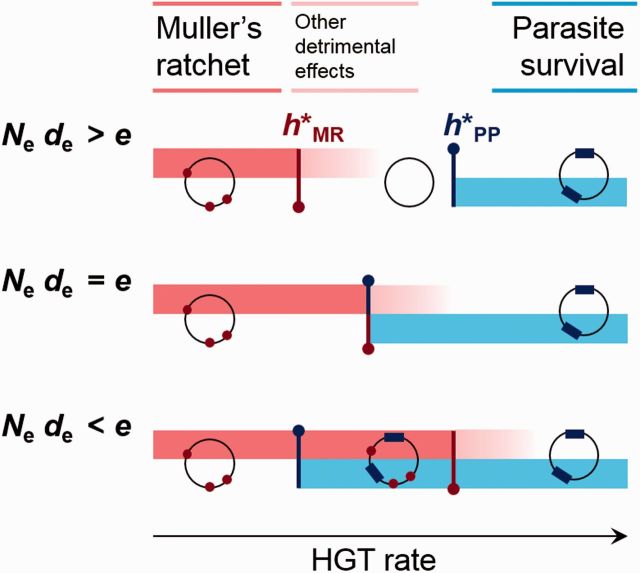
Fig. 3.—
The rate of HGT determines the susceptibility of a population to Muller’s ratchet and parasites. If the HGT rate lies below the critical value , the accumulation of mutations leads to genome degeneration (red regions). Because HGT provides benefits to the population beyond counteracting Muller’s ratchet, gives only an absolute minimum to the HGT level compatible with genome maintenance. Therefore, some detrimental effects will also be observed if the HGT rate is only slightly greater than the critical value (light red shaded regions). On the other side, if the HGT rate is greater than , genomic parasites can persist in the population (blue regions). The critical HGT rates and depend on the effective population size (Ne) and the effective loss bias (de), as illustrated in the figure. Only if the condition Nede > e holds, the hosts can exist free of parasites while preventing mutational meltdown (this is represented as a “clean” genome in the range of intermediate HGT in the upper scenario). In any other case, susceptibility to parasites becomes an inevitable cost that cells must pay to escape Muller’s rathcet.

