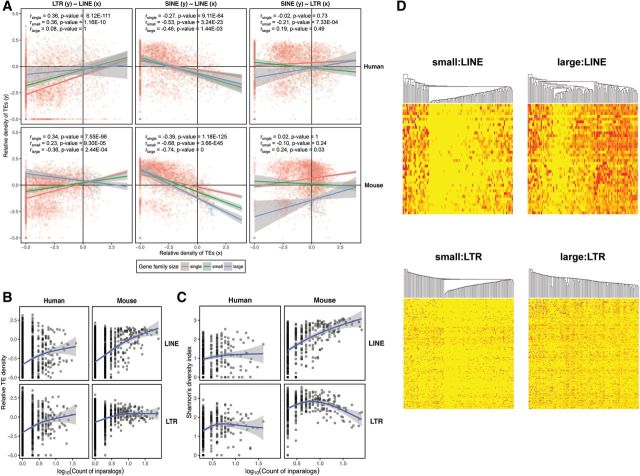
Fig. 3.—
Correlations between gene family size and RT density, diversity and divergence. Correlation of the average lineage-specific RT density between the three RT classes (LINEs, LTRs and SINEs) and the difference in correlation between the three gene family size categories (i.e., single genes, small gene families and large gene families) in the human and mouse genome (A). Correlation was calculated using Spearman’s correlation coefficient. The trend lines and their interactions are based on analysis of covariance (ANCOVA). (B) Relationship to the gene family size of the lineage-specific RT density, averaged for each gene family. (C) Relationship between RT subfamily diversity and gene family size. Gene family size is defined as the common logarithm of the count of inparalogs within a gene family and generalized additive models were used to describe the relationship in (B) and (C). (D) Distribution of RT abundances for the LINE and LTR subfamilies in the mouse genome among the gene families of small and large size. The individual RT subfamilies are represented by rows and gene families by columns in the heat maps. Yellow corresponds to abundances of zero, and the progressively more intense red colors represent the presence of more elements of particular RT subfamilies. We randomly chose 100 gene families to visualize RT abundances in both the LINE and LTR panels. The gene families (columns) were hierarchically clustered based on their pattern of abundance of individual RT subfamilies for LINEs and LTRs. RT subfamilies (rows) are ordered according to the average divergence from consensus for a given RT subfamily from the youngest (top) to the oldest (bottom).

