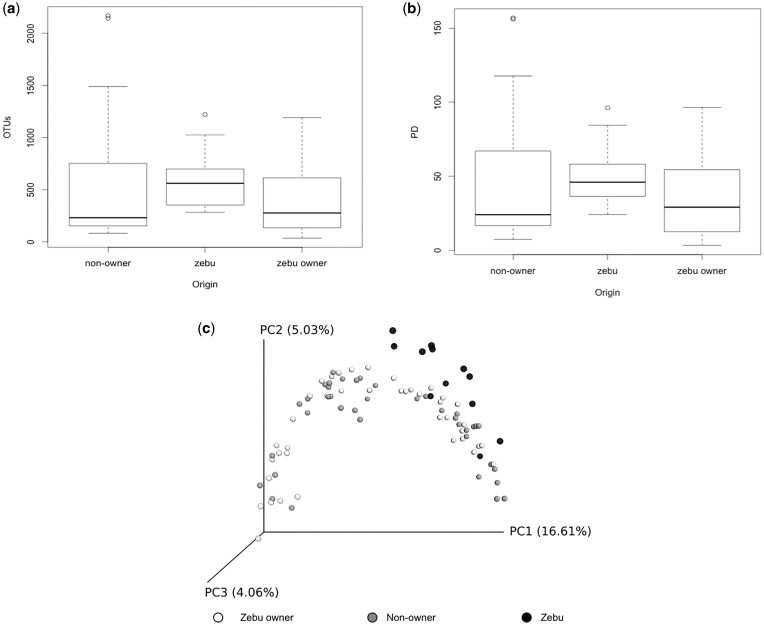
Figure 1.
Comparison of alpha and beta diversity at the host level: (a) Boxplots of number of OTUs on zebu, zebu owners and non-owners (all body sites combined); (b) Boxplots of PD on zebu, zebu owners and non-owners (all body sites combined); (c) PCoA of unweighted UniFrac community distances of microbes between zebu (black), zebu owners (white) and non-owners (gray)

