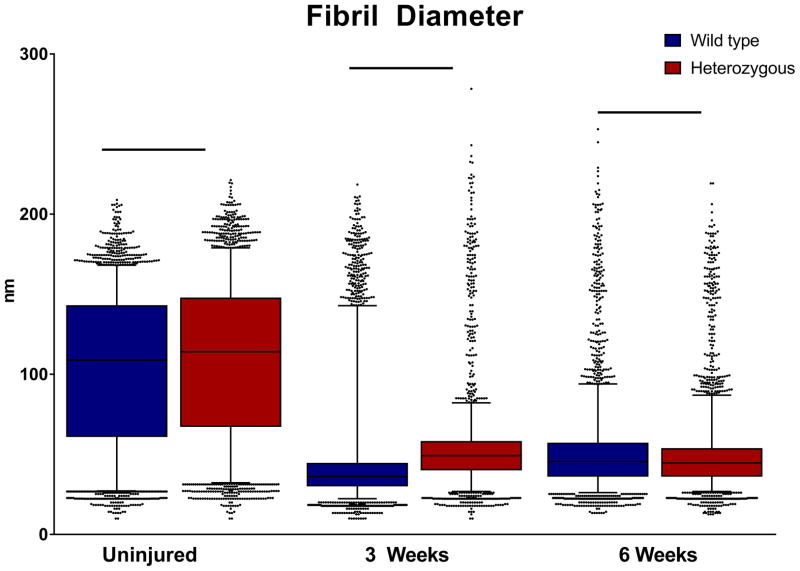
Figure 9. Analysis of fibril diameter distributions post-injury.
Collagen fibril diameters for the HET tendons were significantly larger pre-injury and at 3 weeks post injury. In contrast, the WT tendons had a larger median fibril diameter at 6 weeks post injury. Boxplot whiskers span data between the 5th and 95th percentile. Data points outside this range are shown with individual markers.

