Fig. 2.
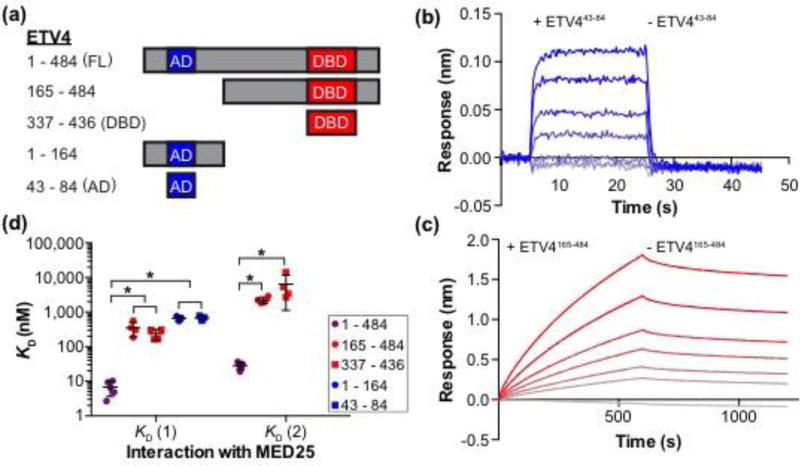
Two regions of ETV4 can independently bind to MED25. (a) Schematic of ETV4 truncations used for binding studies with MED25 ACID. AD, DBD, and FL are abbreviations for activation domain, DNA-binding domain, and full length, respectively. (b) Representative ETV443–84-MED25 sensorgrams with the association and dissociation phases shown. 30 uM ETV443–84 was used for the top sensorgram with serial 1.5-fold dilutions for the next five sensorgrams, and the bottom gray sensorgram corresponds to a control with no ETV443–84. (c) Representative ETV4165–484-MED25 sensorgrams displayed as in (b). 3 uM ETV4165–484 was used for the top sensorgram. The difference in x- and y-axis scales between (b) and (c) reflects the different kinetic constants for these interactions (Table S1). (d) KD values for the interactions between fragments of ETV4 and MED25 ACID. Filled circles and squares represent the KD value from a single experiment with six different concentrations of ETV4, and the horizontal lines represent the mean and standard deviation for three to five replicate experiments. “*” Indicates p < 0.05. Note that there are two KD values for ETV4165–484 and ETV4337–436 as these sensorgrams were better fit by a 2:1 (ETV4:MED25) model. In contrast, there is a single KD value for ETV41–164 and ETV443–84 as these sensorgrams were better fit by a 1:1 model. ETV41–484 data are included from Fig. 1c for reference.

