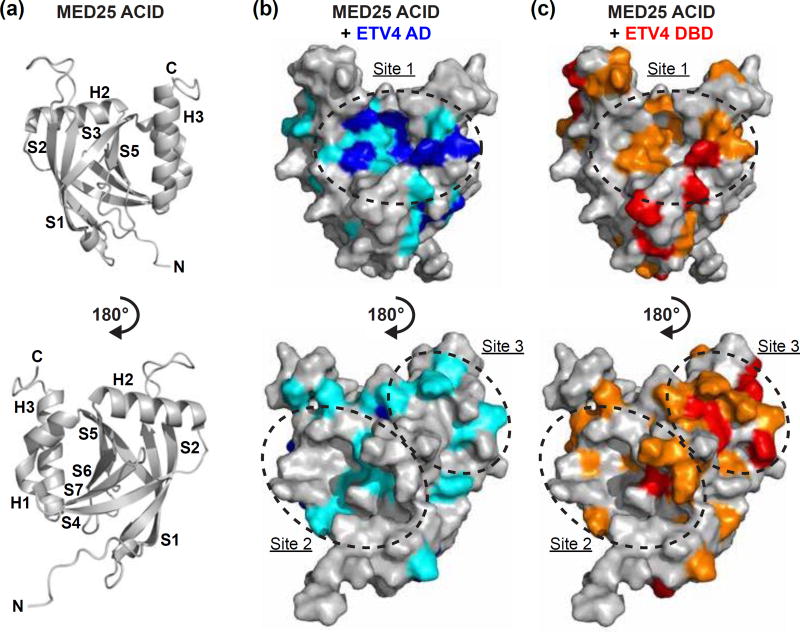
Fig. 5.
NMR spectroscopy suggests a single MED25 binding site for ETV4 AD and multiple binding sites for ETV4 DBD. (a) Cartoon representation of MED25 ACID structure (PDB: 2KY6) [9]. Bottom view is rotated 180° relative to the top view of MED25 ACID. α-helices and β-strands are abbreviated H and S, respectively, and numbered according to progression from N- to C-termini of the domain. (b) MED25 ACID oriented as in (a) but with surface representation and changes to the 15N-HSQC of MED25 ACID upon addition of unlabeled ETV4 AD indicated by color. Upon addition of 0.2 molar equivalents of ETV4 AD, MED25 amide relative peak intensities that were less than the mean are colored teal and those that were in the lowest ten percent are colored blue. (c) MED25 ACID as in (b) with changes to the 15N-HSQC upon addition of unlabeled ETV4 DBD indicated by color. Upon addition of 0.2 molar equivalents of ETV4 DBD, MED25 amide relative peak intensities that were less than the mean are colored orange and those that were in the lowest ten percent are colored in red. Sites of clustered changes upon titration of AD and/or DBD are indicated by dotted lines and arbitrarily named site one, two, or three. See Fig. S5 for 15N-HSQC spectra of MED25 ACID alone and with unlabeled ETV4 AD or ETV4 DBD.

