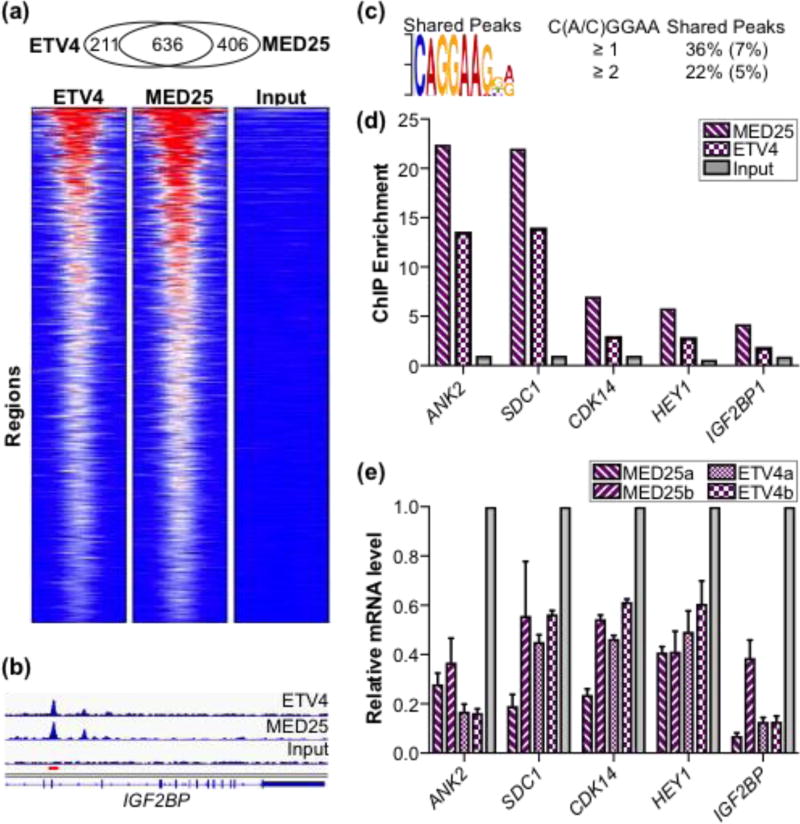
Fig. 8.
ETV4 and MED25 occupancy at regulatory regions genome-wide and effects on expression of associated genes. (a) Overlap of ETV4 and FLAG-MED25 bound regions from PC3 cells displayed as heatmaps of the RPKM from MED25, ETV4, and input control data across the set of shared regions. Heat map ranges from 0 (blue) to 72 (red) RPKM. (b) Graphical display of enriched reads for ETV4 and MED25 ChIP DNA and input DNA in IGF2BP intron (hg19 chr10:54,218,829–54,242,010). Red bar, region assayed by qPCR. (c) ETS binding motif is most over-represented sequence in shared regions as determined by MEME [86]. The MEME, expect-value, E, is 1 × 10⁻²¹. Percentages of peaks with match to motif are shown to right with comparison to randomly generated size-matched peak set in parentheses. (d) qPCR quantification of MED25-FLAG and ETV4 enrichment at putative regulatory elements for genes shown; input values displayed for comparison. Two to three independent biological replicates provided similar patterns, but different maximum levels of enrichment. A representative experiment is shown. (e) Relative expression values for indicated gene as determined by qPCR of total cDNA derived from ETV4 and MED25 knockdown PC3 cells. Two different shRNA constructs were used for both ETV4 and MED25 and denoted as a or b. Average values for biological triplicates are graphed with standard deviation. Relative expression of control knockdown cells is set at 1, and experimental sample values are graphed relative to control.

