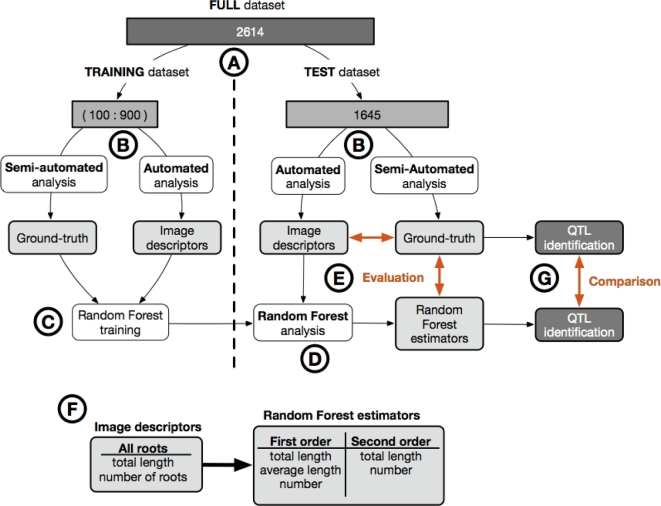
Figure 1:
Overview of the analysis pipeline used in this study. (A) We divided the full dataset (2614 images) into two: a training set (100 to 900 images) and a test set (1645 images). (B) For each dataset, all the images were analysed using a semi-automated root image analysis tool (RootNav) to extract the ground-truth, as well as with a fully automated root image analysis tool (RIA-J) to extract image descriptors (see the text for details). (C) We trained a Random Forest model on the image descriptors and the ground-truth from the training dataset. (D) We applied the Random Forest model on the image descriptors from the test dataset. (E) We compared the image descriptors and the Random Forest estimators from the test dataset with their corresponding ground-truth. (F) Comparison of biologically relevant metrics extracted with the automated analysis and the Random Forest analysis. (G) QTL were identified and compared using both Random Forest estimators and the ground-truth data.

