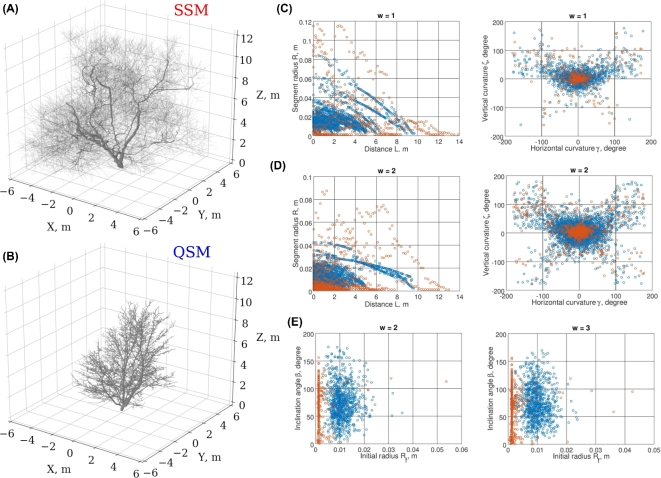
Figure 4:
Low- and high-order adjustment of the stochastic feature tables. The best-fit SSM is obtained through optimization against S0,1 and B2,3,4 merged feature data sets. (A) The best-fit SSM tree. (B) The target QSM tree. (C) Some projection scatters from S1. (D) S2 projection scatters. (E) B2 and B3 projection scatters.

